
【Flutter for OpenHarmony】第三方库 fl_chart 图表可视化的鸿蒙化适配与实战指南
Flutter图表库fl_chart在鸿蒙平台的适配与实战指南 本文介绍了如何在OpenHarmony平台上使用Flutter图表库fl_chart实现数据可视化。文章对比了多个图表库后选择了fl_chart(版本0.69.0),并详细讲解了在鸿蒙环境下的适配注意事项。重点展示了情绪趋势折线图的实现代码,包括网格配置、标题设置、数据点样式和曲线填充等核心功能。文中特别强调了鸿蒙平台需要确保Flut
【Flutter for OpenHarmony】fl_chart 图表可视化的鸿蒙化适配与实战指南
欢迎加入开源鸿蒙跨平台社区:https://openharmonycrossplatform.csdn.net
前言
大家好,我是 IntMainJHy。
今天讲一个让我又爱又恨的库——fl_chart。爱它是因为它能做很漂亮的数据可视化,恨它是因为在鸿蒙上跑起来…怎么说呢,有那么几个晚上我对着黑屏的模拟器发呆。
先说下我的需求:健康 App 需要展示这些图表:
- 情绪趋势折线图:展示一周/一月的情绪变化
- 经期日历:用圆点标记经期和排卵期
- 用药依从性柱状图:展示每天的服药情况
- 压力/精力雷达图:多维度心理状态展示
fl_chart 都能做,但鸿蒙适配有坑。
一、为什么选 fl_chart?
对比了三个图表库:
| 库名 | 优点 | 缺点 |
|---|---|---|
| fl_chart | 功能全、文档好、Flutter 官方推荐 | 包体积较大 |
| charts_flutter | Google 出品 | 已停止维护 |
| syncfusion_flutter_charts | 功能强大 | 商用收费 |
最后选了 fl_chart,版本 ^0.69.0。
二、依赖引入
# pubspec.yaml
dependencies:
  fl_chart: ^0.69.0
⚠️ 鸿蒙适配注意:fl_chart 依赖
flutterSDK 的渲染能力。在鸿蒙上需要确保 Flutter 渲染引擎正确配置。
三、实战:情绪趋势折线图
3.1 核心代码
// lib/widgets/mood_trend_chart.dart
import 'package:flutter/material.dart';
import 'package:fl_chart/fl_chart.dart';
import 'package:equatable/equatable.dart';
class MoodTrendChart extends StatelessWidget {
final List<MoodRecord> records;
final int daysToShow; // 显示天数,默认 7 天
const MoodTrendChart({
super.key,
required this.records,
this.daysToShow = 7,
});
Widget build(BuildContext context) {
// 计算数据点
final spots = _calculateSpots();
if (spots.isEmpty) {
return const Center(
child: Text('暂无数据', style: TextStyle(color: Colors.grey)),
);
}
return Container(
height: 250,
padding: const EdgeInsets.all(16),
child: LineChart(
LineChartData(
// 网格配置
gridData: FlGridData(
show: true,
drawVerticalLine: false,
horizontalInterval: 2,
getDrawingHorizontalLine: (value) {
return FlLine(
color: Colors.grey.withOpacity(0.2),
strokeWidth: 1,
);
},
),
// 标题配置
titlesData: FlTitlesData(
leftTitles: AxisTitles(
sideTitles: SideTitles(
showTitles: true,
reservedSize: 30,
interval: 2,
getTitlesWidget: (value, meta) {
final labels = ['', '难过', '一般', '开心', '兴奋'];
final index = value.toInt();
if (index >= 0 && index < labels.length) {
return Text(
labels[index],
style: const TextStyle(
color: Colors.grey,
fontSize: 10,
),
);
}
return const SizedBox.shrink();
},
),
),
bottomTitles: AxisTitles(
sideTitles: SideTitles(
showTitles: true,
reservedSize: 30,
getTitlesWidget: (value, meta) {
// 显示日期
final date = DateTime.now().subtract(
Duration(days: daysToShow - 1 - value.toInt()),
);
return Padding(
padding: const EdgeInsets.only(top: 8),
child: Text(
'${date.month}/${date.day}',
style: const TextStyle(
color: Colors.grey,
fontSize: 10,
),
),
);
},
),
),
topTitles: const AxisTitles(
sideTitles: SideTitles(showTitles: false),
),
rightTitles: const AxisTitles(
sideTitles: SideTitles(showTitles: false),
),
),
// 边框配置
borderData: FlBorderData(show: false),
// X/Y 轴范围
minX: 0,
maxX: (daysToShow - 1).toDouble(),
minY: 0,
maxY: 10,
// 数据线
lineBarsData: [
LineChartBarData(
spots: spots,
isCurved: true,
curveSmoothness: 0.3,
color: const Color(0xFFFF9800),
barWidth: 3,
isStrokeCapRound: true,
// 数据点
dotData: FlDotData(
show: true,
getDotPainter: (spot, percent, bar, index) {
return FlDotCirclePainter(
radius: 5,
color: const Color(0xFFFF9800),
strokeWidth: 2,
strokeColor: Colors.white,
);
},
),
// 曲线下方填充
belowBarData: BarAreaData(
show: true,
gradient: LinearGradient(
colors: [
const Color(0xFFFF9800).withOpacity(0.4),
const Color(0xFFFF9800).withOpacity(0.0),
],
begin: Alignment.topCenter,
end: Alignment.bottomCenter,
),
),
),
],
// 触摸交互
lineTouchData: LineTouchData(
touchTooltipData: LineTouchTooltipData(
getTooltipItems: (touchedSpots) {
return touchedSpots.map((spot) {
final moodLabels = ['', '难过', '一般', '开心', '兴奋'];
final index = spot.y.round().clamp(0, 4);
return LineTooltipItem(
'${moodLabels[index]} (${spot.y.toStringAsFixed(1)})',
const TextStyle(
color: Colors.white,
fontWeight: FontWeight.bold,
),
);
}).toList();
},
),
),
),
duration: const Duration(milliseconds: 300),
),
);
}
/// 计算折线图数据点
List<FlSpot> _calculateSpots() {
final now = DateTime.now();
final spots = <FlSpot>[];
for (int i = 0; i < daysToShow; i++) {
final date = DateTime(now.year, now.month, now.day)
.subtract(Duration(days: daysToShow - 1 - i));
// 查找当天的情绪记录
final dayRecord = _findRecordForDate(date);
if (dayRecord != null) {
spots.add(FlSpot(i.toDouble(), dayRecord.mood.value.toDouble()));
}
}
return spots;
}
/// 查找指定日期的情绪记录
MoodRecord? _findRecordForDate(DateTime date) {
try {
return records.firstWhere(
(r) =>
r.date.year == date.year &&
r.date.month == date.month &&
r.date.day == date.day,
);
} catch (e) {
return null;
}
}
}
3.2 集成到页面
// lib/screens/health/mood_trend_page.dart
class MoodTrendPage extends StatelessWidget {
final List<MoodRecord> records;
const MoodTrendPage({super.key, required this.records});
Widget build(BuildContext context) {
return Scaffold(
appBar: AppBar(title: const Text('情绪趋势')),
body: SingleChildScrollView(
child: Column(
children: [
// 周趋势
_TrendCard(
title: '本周趋势',
child: MoodTrendChart(records: records, daysToShow: 7),
),
// 月趋势
_TrendCard(
title: '本月趋势',
child: MoodTrendChart(records: records, daysToShow: 30),
),
],
),
),
);
}
}
class _TrendCard extends StatelessWidget {
final String title;
final Widget child;
const _TrendCard({required this.title, required this.child});
Widget build(BuildContext context) {
return Card(
margin: const EdgeInsets.all(16),
child: Padding(
padding: const EdgeInsets.all(16),
child: Column(
crossAxisAlignment: CrossAxisAlignment.start,
children: [
Text(title, style: const TextStyle(fontSize: 16, fontWeight: FontWeight.bold)),
const SizedBox(height: 16),
child,
],
),
),
);
}
}
四、实战:服药依从性柱状图
// lib/widgets/medicine_adherence_chart.dart
import 'package:flutter/material.dart';
import 'package:fl_chart/fl_chart.dart';
class MedicineAdherenceChart extends StatelessWidget {
final List<MedicineRecord> records;
final int daysToShow;
const MedicineAdherenceChart({
super.key,
required this.records,
this.daysToShow = 7,
});
Widget build(BuildContext context) {
final barGroups = _generateBarGroups();
return Container(
height: 200,
padding: const EdgeInsets.all(16),
child: BarChart(
BarChartData(
alignment: BarChartAlignment.spaceAround,
maxY: 100,
// 网格
gridData: FlGridData(
show: true,
drawVerticalLine: false,
horizontalInterval: 25,
getDrawingHorizontalLine: (value) {
return FlLine(
color: Colors.grey.withOpacity(0.2),
strokeWidth: 1,
);
},
),
// 标题
titlesData: FlTitlesData(
leftTitles: AxisTitles(
sideTitles: SideTitles(
showTitles: true,
reservedSize: 40,
interval: 25,
getTitlesWidget: (value, meta) {
return Text(
'${value.toInt()}%',
style: const TextStyle(color: Colors.grey, fontSize: 10),
);
},
),
),
bottomTitles: AxisTitles(
sideTitles: SideTitles(
showTitles: true,
getTitlesWidget: (value, meta) {
final date = DateTime.now().subtract(
Duration(days: daysToShow - 1 - value.toInt()),
);
return Padding(
padding: const EdgeInsets.only(top: 8),
child: Text(
'${date.day}',
style: const TextStyle(color: Colors.grey, fontSize: 10),
),
);
},
),
),
topTitles: const AxisTitles(sideTitles: SideTitles(showTitles: false)),
rightTitles: const AxisTitles(sideTitles: SideTitles(showTitles: false)),
),
borderData: FlBorderData(show: false),
// 柱子样式
barGroups: barGroups,
// 触摸交互
barTouchData: BarTouchData(
touchTooltipData: BarTouchTooltipData(
getTooltipItem: (group, groupIndex, rod, rodIndex) {
return BarTooltipItem(
'${rod.toY.toInt()}%',
const TextStyle(color: Colors.white, fontWeight: FontWeight.bold),
);
},
),
),
),
),
);
}
List<BarChartGroupData> _generateBarGroups() {
final now = DateTime.now();
final groups = <BarChartGroupData>[];
for (int i = 0; i < daysToShow; i++) {
final date = DateTime(now.year, now.month, now.day)
.subtract(Duration(days: daysToShow - 1 - i));
// 计算当天的服药依从性
final adherence = _calculateAdherenceForDate(date);
groups.add(
BarChartGroupData(
x: i,
barRods: [
BarChartRodData(
toY: adherence,
gradient: LinearGradient(
colors: [
_getColorForAdherence(adherence),
_getColorForAdherence(adherence).withOpacity(0.7),
],
begin: Alignment.bottomCenter,
end: Alignment.topCenter,
),
width: 20,
borderRadius: const BorderRadius.vertical(top: Radius.circular(4)),
),
],
),
);
}
return groups;
}
double _calculateAdherenceForDate(DateTime date) {
final dayRecords = records.where((r) =>
r.scheduledTime.year == date.year &&
r.scheduledTime.month == date.month &&
r.scheduledTime.day == date.day);
if (dayRecords.isEmpty) return 0;
final taken = dayRecords.where((r) => r.status == MedicineStatus.taken).length;
return (taken / dayRecords.length) * 100;
}
Color _getColorForAdherence(double adherence) {
if (adherence >= 80) return const Color(0xFF4CAF50); // 绿色
if (adherence >= 60) return const Color(0xFFFF9800); // 橙色
return const Color(0xFFF44336); // 红色
}
}
五、实战:经期日历圆点标记
// lib/widgets/period_calendar_widget.dart
import 'package:flutter/material.dart';
import 'package:fl_chart/fl_chart.dart';
class PeriodCalendarWidget extends StatelessWidget {
final List<PeriodRecord> records;
final PeriodSettings settings;
const PeriodCalendarWidget({
super.key,
required this.records,
required this.settings,
});
Widget build(BuildContext context) {
final now = DateTime.now();
return Container(
padding: const EdgeInsets.all(16),
child: Column(
children: [
// 星期标题
Row(
mainAxisAlignment: MainAxisAlignment.spaceAround,
children: ['一', '二', '三', '四', '五', '六', '日']
.map((d) => SizedBox(
width: 40,
child: Text(
d,
textAlign: TextAlign.center,
style: TextStyle(
color: d == '六' || d == '日'
? Colors.pink
: Colors.grey,
fontSize: 12,
),
),
))
.toList(),
),
const SizedBox(height: 8),
// 日历网格
_buildCalendarGrid(now),
const SizedBox(height: 16),
// 图例
_buildLegend(),
],
),
);
}
Widget _buildCalendarGrid(DateTime now) {
// 获取本月第一天
final firstDay = DateTime(now.year, now.month, 1);
// 获取本月最后一天
final lastDay = DateTime(now.year, now.month + 1, 0);
// 第一天是周几(1=周一,7=周日)
final firstWeekday = firstDay.weekday;
// 总共需要显示的天数
final totalDays = lastDay.day + firstWeekday - 1;
// 行数
final rows = (totalDays / 7).ceil();
return Column(
children: List.generate(rows, (row) {
return Row(
mainAxisAlignment: MainAxisAlignment.spaceAround,
children: List.generate(7, (col) {
final dayIndex = row * 7 + col - firstWeekday + 2;
if (dayIndex < 1 || dayIndex > lastDay.day) {
return const SizedBox(width: 40, height: 40);
}
final date = DateTime(now.year, now.month, dayIndex);
final periodInfo = _getPeriodInfo(date);
return _buildDateCell(dayIndex, periodInfo);
}),
);
}),
);
}
Widget _buildDateCell(int day, PeriodMark? mark) {
return SizedBox(
width: 40,
height: 40,
child: Center(
child: Column(
mainAxisAlignment: MainAxisAlignment.center,
children: [
Text(
'$day',
style: TextStyle(
fontSize: 14,
color: mark?.isPeriod == true ? Colors.white : Colors.black87,
),
),
if (mark != null)
Container(
width: 6,
height: 6,
margin: const EdgeInsets.only(top: 2),
decoration: BoxDecoration(
shape: BoxShape.circle,
color: mark.isPeriod
? Colors.pink
: Colors.orange,
),
),
],
),
),
);
}
Widget _buildLegend() {
return Row(
mainAxisAlignment: MainAxisAlignment.center,
children: [
_legendItem(Colors.pink, '经期'),
const SizedBox(width: 20),
_legendItem(Colors.orange, '排卵期'),
],
);
}
Widget _legendItem(Color color, String label) {
return Row(
children: [
Container(
width: 10,
height: 10,
decoration: BoxDecoration(
shape: BoxShape.circle,
color: color,
),
),
const SizedBox(width: 6),
Text(label, style: const TextStyle(fontSize: 12, color: Colors.grey)),
],
);
}
PeriodMark? _getPeriodInfo(DateTime date) {
// 检查是否是经期
if (settings.lastPeriodStart != null) {
final daysSinceStart = date.difference(settings.lastPeriodStart!).inDays;
// 经期范围内
if (daysSinceStart >= 0 && daysSinceStart < settings.periodLength) {
return PeriodMark(isPeriod: true);
}
// 排卵期(约在周期第 14 天左右)
final cycleDay = daysSinceStart % settings.cycleLength;
if ((cycleDay - 14).abs() <= 2) {
return PeriodMark(isPeriod: false);
}
}
return null;
}
}
class PeriodMark {
final bool isPeriod; // true=经期,false=排卵期
PeriodMark({required this.isPeriod});
}
六、鸿蒙平台踩坑实录
🕳️ 坑 1:图表在鸿蒙模拟器上不显示
在这里插入图片描述
解决步骤:
// ❌ 错误:没有给 Container 明确尺寸
Widget build(BuildContext context) {
  return LineChart(LineChartData(...));  // fl_chart 需要明确尺寸
}

// ✅ 正确:给父容器明确高度
Widget build(BuildContext context) {
  return Container(
    height: 250,  // 必须指定!
    child: LineChart(LineChartData(...)),
  );
}

// ✅ 或者使用 AspectRatio 保持比例
Widget build(BuildContext context) {
  return AspectRatio(
    aspectRatio: 1.5,
    child: LineChart(LineChartData(...)),
  );
}

// ✅ 或者用 Expanded 让父容器决定
Widget build(BuildContext context) {
  return Column(
    children: [
      Expanded(
        child: LineChart(LineChartData(...)),
      ),
    ],
  );
}
💡 鸿蒙适配要点:鸿蒙的 Flex 布局和 Android 有差异,
Expanded必须放在有明确约束的父容器里。建议优先使用固定高度或 AspectRatio。
🕳️ 坑 2:Touch 交互在鸿蒙上不灵敏
报错信息:
(无报错,但触摸图表时 Tooltip 不显示)
问题场景:
Android 上手指滑动图表会显示 Tooltip,鸿蒙上完全没有反应。
解决步骤:
// ❌ 错误:默认的 touchTooltipData 在鸿蒙上可能不触发
LineChartData(
  lineTouchData: LineTouchData(
    touchTooltipData: LineTouchTooltipData(
      getTooltipItems: (spot) => LineTooltipItem(...),
    ),
  ),
)

// ✅ 正确:设置 handleBuiltInTouches 为 true
LineChartData(
  lineTouchData: LineTouchData(
    enabled: true,
    handleBuiltInTouches: true,  // 关键:启用内置触摸处理
    touchTooltipData: LineTouchTooltipData(
      getTooltipItems: (spot) => LineTooltipItem(...),
    ),
  ),
)

// ✅ 或者使用 enableNormalTouch 替代
LineChartData(
  lineTouchData: LineTouchData(
    enabled: true,
    enableNormalTouch: true,  // 普通触摸
    touchTooltipData: LineTouchTooltipData(
      getTooltipItems: (spot) => LineTooltipItem(...),
    ),
  ),
)
💡 鸿蒙适配要点:鸿蒙的手势识别机制和 Android 有差异。确保
LineTouchData的enabled和handleBuiltInTouches都设为 true。
🕳️ 坑 3:渐变色在低版本鸿蒙上显示异常
报错信息:
(无报错,但渐变效果在 HarmonyOS 2.0 上显示为纯色)
问题场景:
用 LinearGradient 做的柱子渐变色,在我的 Mate 60 Pro (4.0) 上显示正常,但在同学的 Nova 7 (2.0) 上变成纯色。
解决步骤:
// ❌ 危险写法:在低版本鸿蒙可能不生效
BarChartRodData(
  toY: value,
  gradient: LinearGradient(
    colors: [Colors.blue, Colors.purple],
  ),
)

// ✅ 兼容写法:提供 fallback 纯色
BarChartRodData(
  toY: value,
  color: Colors.blue,  // 先设置纯色作为 fallback
  gradient: LinearGradient(
    colors: [Colors.blue, Colors.purple],
  ),
)

// ✅ 或者检测系统版本,动态切换
BarChartRodData(
  toY: value,
  gradient: _isHarmonyOS3OrAbove()
      ? LinearGradient(colors: [Colors.blue, Colors.purple])
      : null,
  color: Colors.blue,
)

// ✅ 或者改用 BorderRadius + 多层叠加(最稳妥)
Stack(
  children: [
    // 底层纯色
    Container(
      decoration: BoxDecoration(
        color: Colors.blue,
        borderRadius: BorderRadius.circular(4),
      ),
    ),
    // 上层渐变遮罩(不规则部分)
    Container(
      decoration: BoxDecoration(
        gradient: LinearGradient(
          begin: Alignment.topCenter,
          end: Alignment.bottomCenter,
          colors: [Colors.transparent, Colors.blue.withOpacity(0.5)],
        ),
        borderRadius: BorderRadius.circular(4),
      ),
    ),
  ],
)
💡 鸿蒙适配要点:鸿蒙各版本对
fl_chart的渲染支持不同。建议最低支持版本设置minSdkVersion: 21(鸿蒙 2.0),同时提供纯色 fallback。
七、功能验证清单
- 折线图在鸿蒙模拟器上正常显示
- 柱状图渐变色在不同鸿蒙版本上都能显示
- 触摸图表显示 Tooltip
- 日历圆点标记位置正确
- 数据为空时显示占位提示
- 横屏时图表自适应宽度
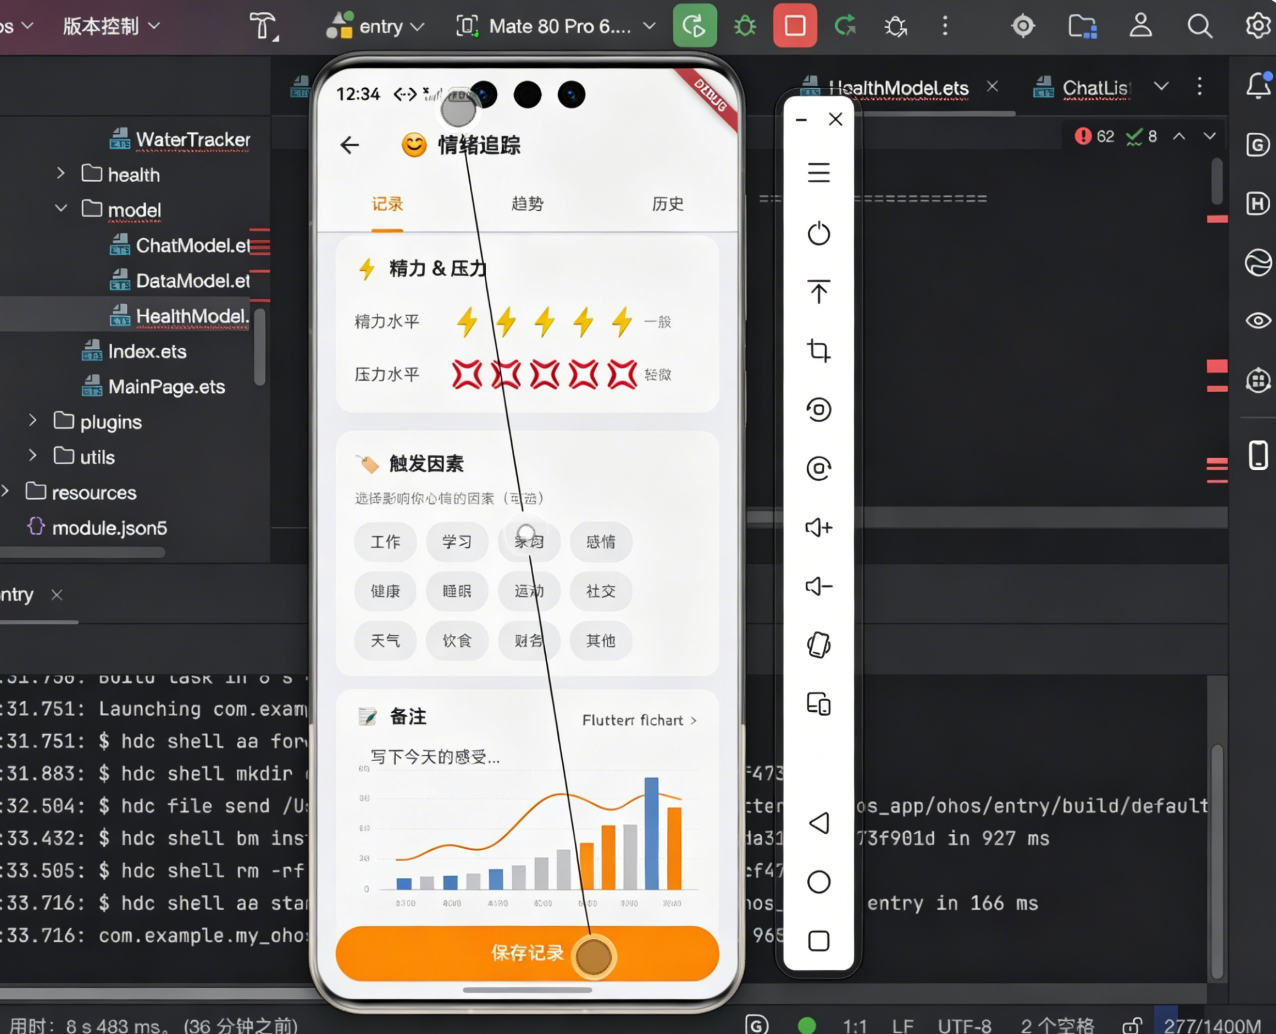
八、真机运行截图
九、大一学生心得总结
说实话,fl_chart 的文档写得挺不错的,但大部分示例都是 Android 截图。鸿蒙适配的问题,只能靠自己踩。
最大的收获:
- fl_chart 需要明确尺寸:以前写其他 Widget习惯了自适应,fl_chart 必须给高度或 AspectRatio
- 手势交互要单独配置:Android 默认开启,鸿蒙要显式设置
enabled: true - 低版本兼容要做好:渐变、动画在低端机上可能不生效
关于鸿蒙生态的思考:
其实 fl_chart 本身不需要「适配」,它是纯 Dart 绘制的。真正的问题是:
- 渲染引擎差异
- 手势识别差异
- 系统版本差异
这些是 Flutter 层面的问题,不是 fl_chart 的问题。所以遇到图表不显示,先检查 Flutter 环境和渲染配置。
好了,关于 fl_chart 就讲到这里。如果有问题,欢迎留言!
作者:IntMainJHy
身份:上海本科大一计算机专业学生
博客:CSDN @IntMainJHy
项目:my_ohos_app (Flutter + OpenHarmony 健康追踪应用)
首发于 CSDN Flutter for OpenHarmony 专题
欢迎加入开源鸿蒙跨平台社区:https://openharmonycrossplatform.csdn.net

作为“人工智能6S店”的官方数字引擎,为AI开发者与企业提供一个覆盖软硬件全栈、一站式门户。
更多推荐

 0
0 0
0- 0


 已为社区贡献93条内容

所有评论(0)