
使用Flutter强大的图标库fl_chart优化鸿蒙版天气预报温度、降水量、湿度展示
本文介绍了如何在Flutter天气应用中使用fl_chart图表库实现数据可视化。主要内容包括: fl_chart库特性:提供多种图表类型、高度可定制、性能优秀且易于使用 天气应用场景:用于展示温度、降水量和湿度等数据的趋势变化 实现流程:从添加依赖、项目结构设计到核心图表组件的封装 核心功能:支持动态切换3/7/10/15/30天的预报数据,通过折线图和柱状图直观呈现 该方案通过组件化设计,将图
·
📚 目录
1. 概述
1.1 什么是 Fl Chart?
fl_chart 是一个强大的 Flutter 图表库,提供了:
- ✅ 丰富的图表类型:折线图、柱状图、饼图、散点图等
- ✅ 高度可定制:支持自定义颜色、样式、动画等
- ✅ 性能优秀:流畅的动画和渲染性能
- ✅ 易于使用:简单的 API,几行代码即可创建图表
- ✅ 跨平台:支持 Android、iOS、Web、HarmonyOS 等平台
1.2 为什么在天气应用中使用 Fl Chart?
在天气应用中,图表可以帮助用户:
| 功能 | 说明 |
|---|---|
| 📈 温度趋势 | 直观展示未来几天的温度变化 |
| 🌧️ 降水量趋势 | 清晰显示降水量的分布情况 |
| 💧 湿度趋势 | 帮助用户了解湿度变化 |
| 📊 数据可视化 | 将数据转化为直观的图表 |
1.3 应用场景
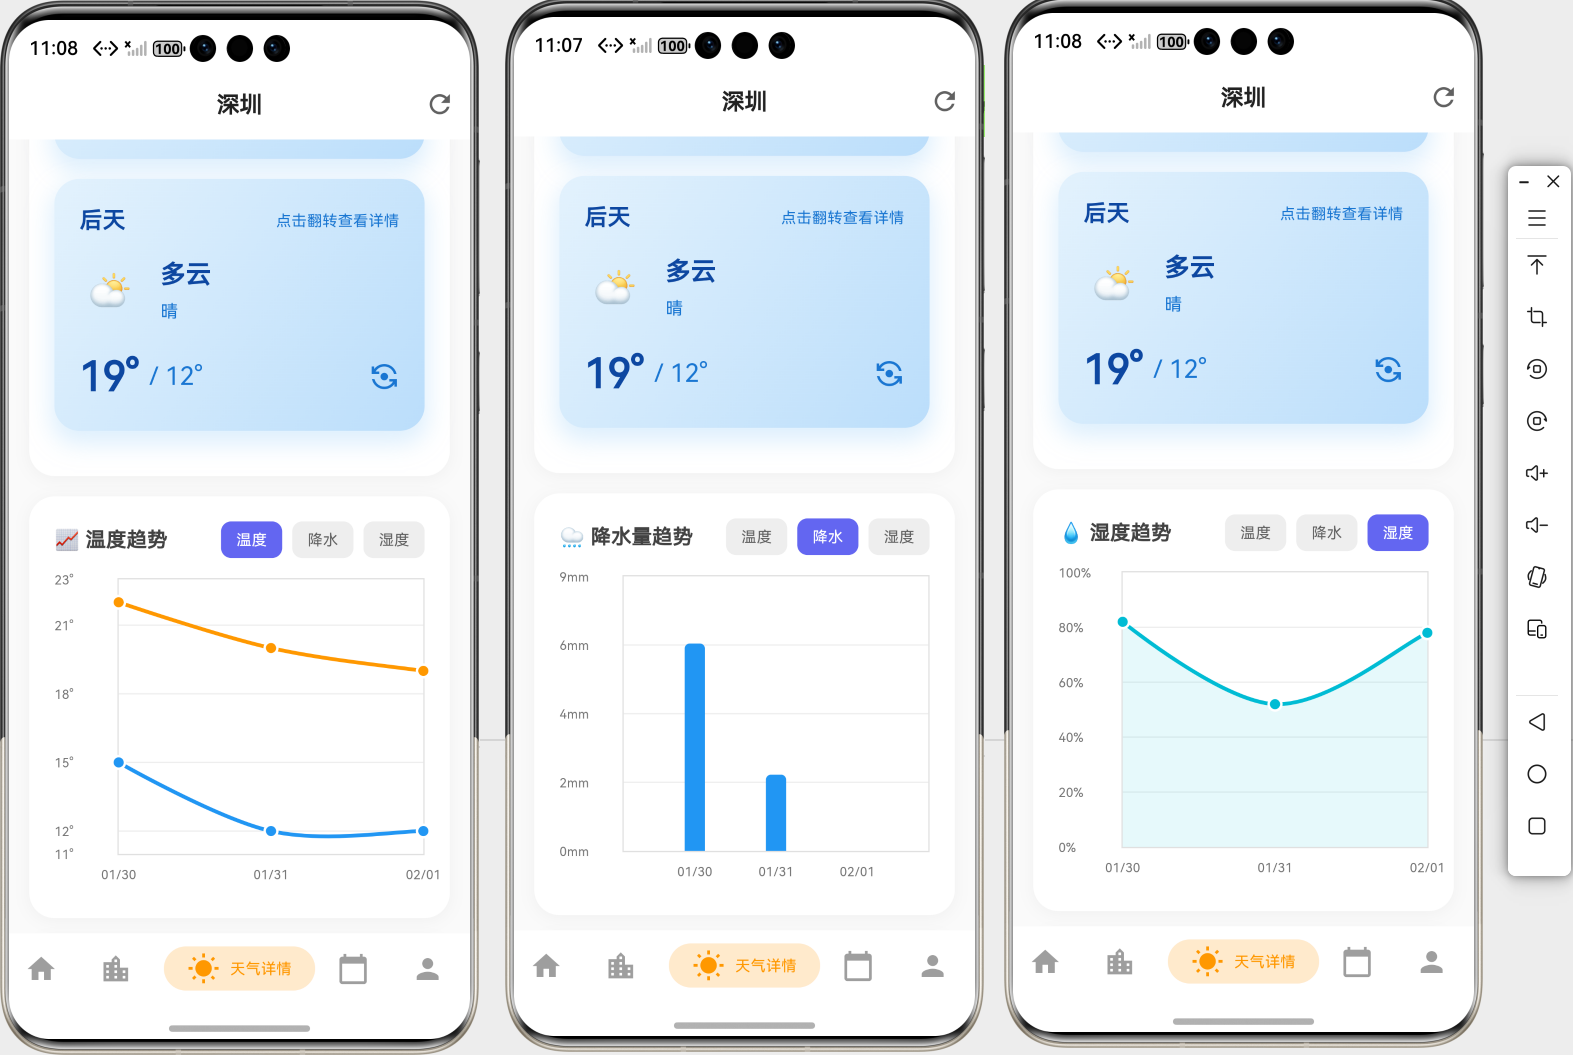
在天气应用中,我们使用 Fl Chart 实现:
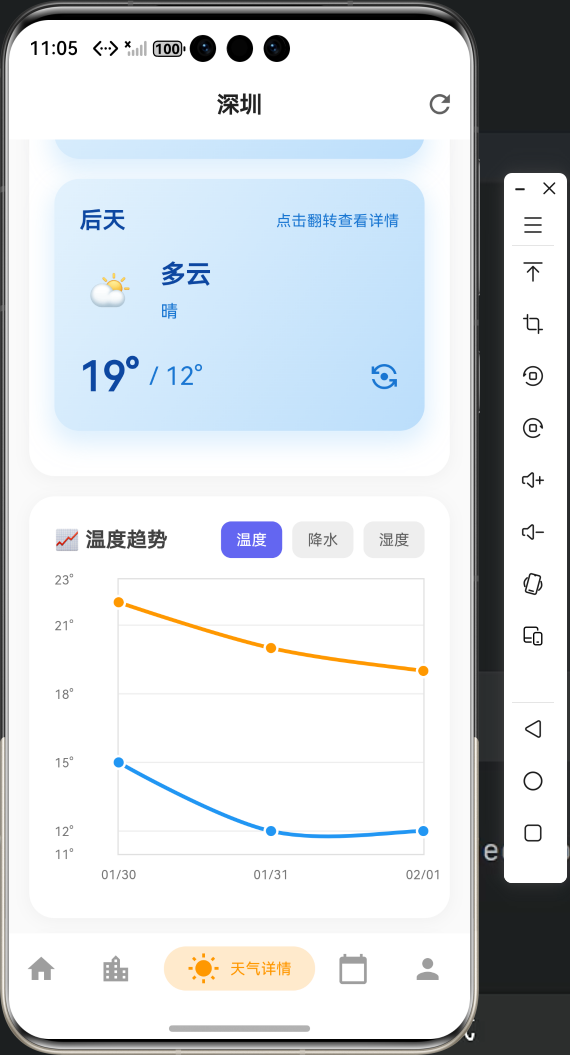
- 📈 温度趋势图表:显示最高温度和最低温度的变化趋势
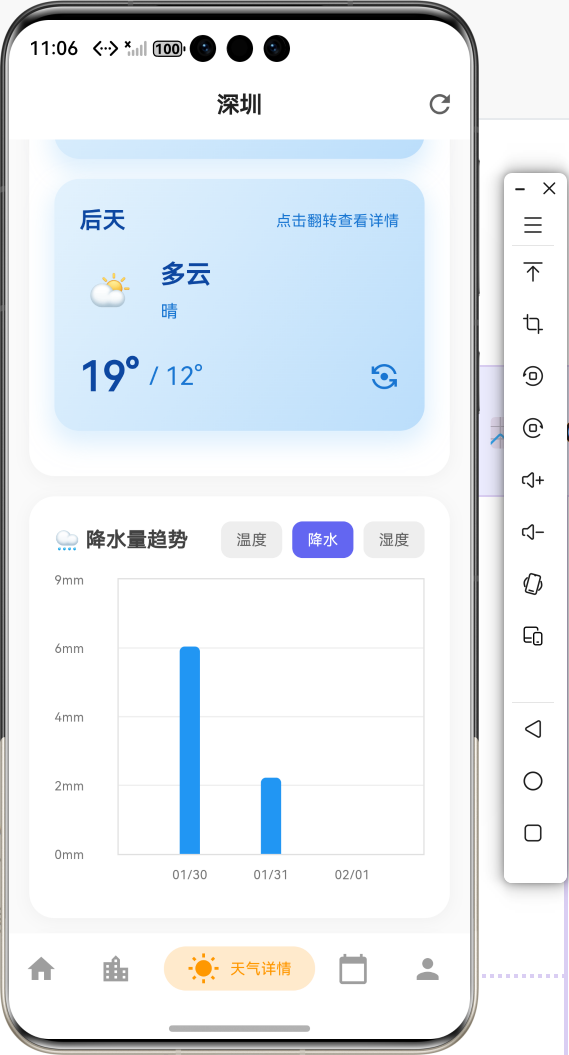
- 🌧️ 降水量趋势图表:展示未来几天的降水量分布
- 💧 湿度趋势图表:显示相对湿度的变化情况
- 📊 多天预报可视化:支持 3、7、10、15、30 天的预报数据展示
1.4 功能流程图
2. 引入三方库
2.1 添加依赖
在 pubspec.yaml 文件的 dependencies 部分添加:
dependencies:
  flutter:
    sdk: flutter

  # Flutter 图表组件
  fl_chart: ^0.69.0
2.2 安装依赖
在项目根目录运行:
flutter pub get
预期输出:
Resolving dependencies...
Downloading packages...
+ fl_chart 0.69.2
Got dependencies!
2.3 依赖说明
| 依赖包 | 版本 | 用途 |
|---|---|---|
fl_chart |
^0.69.0 | Flutter 图表组件核心库,提供图表渲染功能 |
2.4 导入库
在需要使用图表的文件中导入:
import 'package:fl_chart/fl_chart.dart';
3. 目录结构
3.1 项目结构
lib/
├── widgets/
│   └── weather_trend_chart.dart    # 天气趋势图表组件
├── screens/
│   └── weather_detail_page.dart    # 天气详情页(使用图表)
└── models/
    └── weather_models.dart         # 天气数据模型
3.2 文件说明
-
weather_trend_chart.dart:天气趋势图表组件- 封装图表创建逻辑
- 支持温度、降水量、湿度三种图表类型
- 提供统一的图表接口
-
weather_detail_page.dart:天气详情页面- 集成天气趋势图表
- 根据选择的预报天数动态更新图表
4. 核心代码解读
4.1 图表组件架构
4.2 图表组件实现
创建 lib/widgets/weather_trend_chart.dart 文件:
import 'package:flutter/material.dart';
import 'package:fl_chart/fl_chart.dart';
import '../models/weather_models.dart';
/// 天气趋势图表组件
/// 支持显示温度、降水量等天气数据的趋势图表
class WeatherTrendChart extends StatelessWidget {
/// 预报数据列表
final List<Daily> dailyList;
/// 图表类型
final ChartType chartType;
/// 图表高度
final double height;
const WeatherTrendChart({
super.key,
required this.dailyList,
this.chartType = ChartType.temperature,
this.height = 250,
});
Widget build(BuildContext context) {
if (dailyList.isEmpty) {
return const SizedBox.shrink();
}
return Container(
margin: const EdgeInsets.symmetric(horizontal: 16),
padding: const EdgeInsets.all(20),
decoration: BoxDecoration(
color: Colors.white,
borderRadius: BorderRadius.circular(20),
boxShadow: [
BoxShadow(
color: Colors.black.withValues(alpha: 0.04),
blurRadius: 10,
offset: const Offset(0, 2),
),
],
),
child: Column(
crossAxisAlignment: CrossAxisAlignment.start,
children: [
Text(
_getChartTitle(),
style: TextStyle(
fontSize: 16,
fontWeight: FontWeight.w600,
color: Colors.grey.shade800,
),
),
const SizedBox(height: 16),
SizedBox(
height: height,
child: _buildChart(),
),
],
),
);
}
/// 获取图表标题
String _getChartTitle() {
switch (chartType) {
case ChartType.temperature:
return '📈 温度趋势';
case ChartType.precipitation:
return '🌧️ 降水量趋势';
case ChartType.humidity:
return '💧 湿度趋势';
}
}
/// 构建图表
Widget _buildChart() {
switch (chartType) {
case ChartType.temperature:
return _buildTemperatureChart();
case ChartType.precipitation:
return _buildPrecipitationChart();
case ChartType.humidity:
return _buildHumidityChart();
}
}
// ... 其他方法实现
}
关键属性说明:
dailyList:预报数据列表,包含多天的天气数据chartType:图表类型(温度、降水量、湿度)height:图表高度,默认 250
4.3 温度趋势图表实现
/// 构建温度趋势图表
Widget _buildTemperatureChart() {
  // 1. 创建最高温度数据点
  final spotsMax = dailyList.asMap().entries.map((entry) {
    final temp = double.tryParse(entry.value.tempMax) ?? 0.0;
    return FlSpot(entry.key.toDouble(), temp);
  }).toList();

  // 2. 创建最低温度数据点
  final spotsMin = dailyList.asMap().entries.map((entry) {
    final temp = double.tryParse(entry.value.tempMin) ?? 0.0;
    return FlSpot(entry.key.toDouble(), temp);
  }).toList();

  // 3. 计算 Y 轴范围
  final maxTemp = dailyList.map((d) => double.tryParse(d.tempMax) ?? 0.0)
      .reduce((a, b) => a > b ? a : b);
  final minTemp = dailyList.map((d) => double.tryParse(d.tempMin) ?? 0.0)
      .reduce((a, b) => a < b ? a : b);
  final tempRange = maxTemp - minTemp;
  final minY = (minTemp - tempRange * 0.1).floor().toDouble();
  final maxY = (maxTemp + tempRange * 0.1).ceil().toDouble();

  // 4. 创建折线图
  return LineChart(
    LineChartData(
      gridData: FlGridData(
        show: true,
        drawVerticalLine: false,
        horizontalInterval: (maxY - minY) / 4,
        getDrawingHorizontalLine: (value) {
          return FlLine(
            color: Colors.grey.shade200,
            strokeWidth: 1,
          );
        },
      ),
      titlesData: FlTitlesData(
        show: true,
        bottomTitles: AxisTitles(
          sideTitles: SideTitles(
            showTitles: true,
            reservedSize: 30,
            interval: 1,
            getTitlesWidget: (value, meta) {
              if (value.toInt() >= 0 && value.toInt() < dailyList.length) {
                final date = dailyList[value.toInt()].fxDate;
                final dateStr = date.split('-');
                return Padding(
                  padding: const EdgeInsets.only(top: 8),
                  child: Text(
                    '${dateStr[1]}/${dateStr[2]}',
                    style: TextStyle(
                      fontSize: 10,
                      color: Colors.grey.shade600,
                    ),
                  ),
                );
              }
              return const Text('');
            },
          ),
        ),
        leftTitles: AxisTitles(
          sideTitles: SideTitles(
            showTitles: true,
            reservedSize: 50,
            interval: (maxY - minY) / 4,
            getTitlesWidget: (value, meta) {
              return Text(
                '${value.toInt()}°',
                style: TextStyle(
                  fontSize: 10,
                  color: Colors.grey.shade600,
                ),
              );
            },
          ),
        ),
      ),
      borderData: FlBorderData(
        show: true,
        border: Border.all(color: Colors.grey.shade300),
      ),
      minX: 0,
      maxX: (dailyList.length - 1).toDouble(),
      minY: minY,
      maxY: maxY,
      lineBarsData: [
        // 最高温度线(橙色)
        LineChartBarData(
          spots: spotsMax,
          isCurved: true,
          color: Colors.orange,
          barWidth: 3,
          isStrokeCapRound: true,
          dotData: FlDotData(
            show: true,
            getDotPainter: (spot, percent, barData, index) {
              return FlDotCirclePainter(
                radius: 4,
                color: Colors.orange,
                strokeWidth: 2,
                strokeColor: Colors.white,
              );
            },
          ),
        ),
        // 最低温度线(蓝色)
        LineChartBarData(
          spots: spotsMin,
          isCurved: true,
          color: Colors.blue,
          barWidth: 3,
          isStrokeCapRound: true,
          dotData: FlDotData(
            show: true,
            getDotPainter: (spot, percent, barData, index) {
              return FlDotCirclePainter(
                radius: 4,
                color: Colors.blue,
                strokeWidth: 2,
                strokeColor: Colors.white,
              );
            },
          ),
        ),
      ],
    ),
  );
}
关键步骤说明:
- 数据转换:将
Daily数据转换为FlSpot数据点 - Y 轴范围计算:根据数据自动计算合适的 Y 轴范围
- 图表配置:配置网格、标题、边框等
- 线条数据:创建最高温度和最低温度两条线
4.4 降水量趋势图表实现
/// 构建降水量趋势图表
Widget _buildPrecipitationChart() {
  // 1. 创建降水量数据点
  final spots = dailyList.asMap().entries.map((entry) {
    final precip = double.tryParse(entry.value.precip) ?? 0.0;
    return FlSpot(entry.key.toDouble(), precip);
  }).toList();

  // 2. 计算最大降水量
  final maxPrecip = dailyList.map((d) => double.tryParse(d.precip) ?? 0.0)
      .reduce((a, b) => a > b ? a : b);
  final maxY = maxPrecip > 0 ? (maxPrecip * 1.2).ceil().toDouble() : 10.0;

  // 3. 创建柱状图
  return BarChart(
    BarChartData(
      gridData: FlGridData(
        show: true,
        drawVerticalLine: false,
        horizontalInterval: maxY / 4,
      ),
      titlesData: FlTitlesData(
        show: true,
        bottomTitles: AxisTitles(
          sideTitles: SideTitles(
            showTitles: true,
            reservedSize: 30,
            interval: 1,
            getTitlesWidget: (value, meta) {
              if (value.toInt() >= 0 && value.toInt() < dailyList.length) {
                final date = dailyList[value.toInt()].fxDate;
                final dateStr = date.split('-');
                return Padding(
                  padding: const EdgeInsets.only(top: 8),
                  child: Text(
                    '${dateStr[1]}/${dateStr[2]}',
                    style: TextStyle(
                      fontSize: 10,
                      color: Colors.grey.shade600,
                    ),
                  ),
                );
              }
              return const Text('');
            },
          ),
        ),
        leftTitles: AxisTitles(
          sideTitles: SideTitles(
            showTitles: true,
            reservedSize: 50,
            interval: maxY / 4,
            getTitlesWidget: (value, meta) {
              return Text(
                '${value.toInt()}mm',
                style: TextStyle(
                  fontSize: 10,
                  color: Colors.grey.shade600,
                ),
              );
            },
          ),
        ),
      ),
      borderData: FlBorderData(
        show: true,
        border: Border.all(color: Colors.grey.shade300),
      ),
      minX: 0,
      maxX: (dailyList.length - 1).toDouble(),
      minY: 0,
      maxY: maxY,
      barGroups: dailyList.asMap().entries.map((entry) {
        final precip = double.tryParse(entry.value.precip) ?? 0.0;
        return BarChartGroupData(
          x: entry.key,
          barRods: [
            BarChartRodData(
              toY: precip,
              color: Colors.blue,
              width: 16,
              borderRadius: const BorderRadius.vertical(
                top: Radius.circular(4),
              ),
            ),
          ],
        );
      }).toList(),
    ),
  );
}
4.5 数据流程
5. 实际步骤
5.1 步骤1:添加依赖
在 pubspec.yaml 中添加:
dependencies:
  fl_chart: ^0.69.0
运行 flutter pub get 安装依赖。
5.2 步骤2:创建图表组件
创建 lib/widgets/weather_trend_chart.dart 文件,参考上面的代码实现。
💡 新手提示:
- 使用
StatelessWidget创建无状态组件 - 通过构造函数接收数据和配置
- 使用
switch语句根据图表类型选择不同的构建方法
5.3 步骤3:在页面中集成图表
在 weather_detail_page.dart 中:
import '../widgets/weather_trend_chart.dart';

// 在页面底部添加图表
if (forecast.daily != null && forecast.daily!.isNotEmpty)
  WeatherTrendChart(
    dailyList: _getFilteredDailyList(forecast.daily!),
    chartType: ChartType.temperature,
  ),
5.4 步骤4:实现数据过滤方法
/// 获取过滤后的预报数据列表(根据选择的天数)
List<Daily> _getFilteredDailyList(List<Daily> dailyList) {
  final days = int.tryParse(_selectedDays.replaceAll('d', '')) ?? 7;
  return dailyList.take(days).toList();
}
功能说明:
- 根据用户选择的预报天数(3、7、10、15、30)过滤数据
- 只显示对应天数的预报数据
5.5 步骤5:测试图表
运行应用,检查:
- ✅ 图表是否正确显示
- ✅ 数据是否正确映射
- ✅ 切换预报天数时图表是否更新
- ✅ 图表样式是否符合预期
6. 常见错误与解决方案
6.1 错误:图表不显示
错误信息:
NoSuchMethodError: The method 'toDouble' was called on null.
可能原因:
- 数据为空或格式不正确
- 数据解析失败
解决方案:
// ✅ 正确:添加数据检查
if (dailyList.isEmpty) {
  return const SizedBox.shrink();
}

// ✅ 正确:使用安全的类型转换
final temp = double.tryParse(entry.value.tempMax) ?? 0.0;
6.2 错误:Y 轴范围不正确
可能原因:
- Y 轴范围计算错误
- 数据值超出范围
解决方案:
// ✅ 正确:动态计算 Y 轴范围
final maxTemp = dailyList.map((d) => double.tryParse(d.tempMax) ?? 0.0)
    .reduce((a, b) => a > b ? a : b);
final minTemp = dailyList.map((d) => double.tryParse(d.tempMin) ?? 0.0)
    .reduce((a, b) => a < b ? a : b);
final tempRange = maxTemp - minTemp;
final minY = (minTemp - tempRange * 0.1).floor().toDouble();
final maxY = (maxTemp + tempRange * 0.1).ceil().toDouble();
6.3 错误:X 轴标签不显示
可能原因:
reservedSize设置太小getTitlesWidget返回空字符串
解决方案:
// ✅ 正确:设置合适的 reservedSize
bottomTitles: AxisTitles(
  sideTitles: SideTitles(
    showTitles: true,
    reservedSize: 30,  // 确保有足够空间
    interval: 1,
    getTitlesWidget: (value, meta) {
      if (value.toInt() >= 0 && value.toInt() < dailyList.length) {
        // 返回有效的标签文本
        return Text('标签');
      }
      return const Text('');
    },
  ),
),
6.4 错误:图表性能问题
可能原因:
- 数据量过大
- 图表更新过于频繁
解决方案:
// ✅ 正确:限制数据量
List<Daily> _getFilteredDailyList(List<Daily> dailyList) {
  final days = int.tryParse(_selectedDays.replaceAll('d', '')) ?? 7;
  return dailyList.take(days).toList();  // 只取需要的数据
}

// ✅ 正确:使用 const 构造函数
const SizedBox(height: 16),
6.5 错误:图表类型不匹配
可能原因:
ChartType枚举未定义- 导入路径错误
解决方案:
// ✅ 正确:定义图表类型枚举
enum ChartType {
  temperature,   // 温度趋势
  precipitation, // 降水量趋势
  humidity,      // 湿度趋势
}

// ✅ 正确:导入图表组件
import '../widgets/weather_trend_chart.dart';
7. 进阶功能
7.1 多图表切换
class _WeatherTrendChartState extends State<WeatherTrendChart> {
ChartType _currentChartType = ChartType.temperature;
Widget build(BuildContext context) {
return Column(
children: [
// 图表类型选择器
Row(
children: [
_buildChartTypeButton('温度', ChartType.temperature),
_buildChartTypeButton('降水量', ChartType.precipitation),
_buildChartTypeButton('湿度', ChartType.humidity),
],
),
// 图表
WeatherTrendChart(
dailyList: widget.dailyList,
chartType: _currentChartType,
),
],
);
}
Widget _buildChartTypeButton(String label, ChartType type) {
final isSelected = _currentChartType == type;
return GestureDetector(
onTap: () {
setState(() {
_currentChartType = type;
});
},
child: Container(
padding: const EdgeInsets.symmetric(horizontal: 16, vertical: 8),
decoration: BoxDecoration(
color: isSelected ? Colors.blue : Colors.grey.shade200,
borderRadius: BorderRadius.circular(8),
),
child: Text(
label,
style: TextStyle(
color: isSelected ? Colors.white : Colors.grey.shade700,
),
),
),
);
}
}
7.2 图表交互
7.3 图表动画
LineChart(
  LineChartData(
    // ... 其他配置
    lineTouchData: LineTouchData(
      touchTooltipData: LineTouchTooltipData(
        getTooltipItems: (List<LineBarSpot> touchedSpots) {
          return touchedSpots.map((LineBarSpot touchedSpot) {
            return LineTooltipItem(
              '${touchedSpot.y.toInt()}°',
              const TextStyle(
                color: Colors.white,
                fontWeight: FontWeight.bold,
              ),
            );
          }).toList();
        },
      ),
    ),
  ),
)
7.4 图表样式自定义
// 自定义颜色主题
class ChartTheme {
  static const Color primaryColor = Color(0xFF6366F1);
  static const Color secondaryColor = Color(0xFF8B5CF6);
  static const Color accentColor = Color(0xFFEC4899);

  static FlTitlesData getTitlesData() {
    return FlTitlesData(
      show: true,
      leftTitles: AxisTitles(
        sideTitles: SideTitles(
          showTitles: true,
          reservedSize: 50,
          getTitlesWidget: (value, meta) {
            return Text(
              '${value.toInt()}°',
              style: const TextStyle(
                color: Colors.grey,
                fontSize: 10,
              ),
            );
          },
        ),
      ),
      // ... 其他配置
    );
  }
}
8. 参考资料
9. 功能演示流程图
🎉 祝你开发顺利! 🚀
欢迎加入开源鸿蒙跨平台社区

作为“人工智能6S店”的官方数字引擎,为AI开发者与企业提供一个覆盖软硬件全栈、一站式门户。
更多推荐

 6
6 0
0- 0


 已为社区贡献19条内容

所有评论(0)