
鸿蒙新特性实战:@ohos.hidebug 打造性能诊断中心
前言
性能优化是移动开发中绕不开的话题。无论是用户反馈"应用变卡了"、测试报告"内存占用过高"、还是产品经理质疑"为什么启动这么慢",开发者都需要一套可靠的性能诊断工具来定位问题。Android 开发者有 Android Studio 的 Profiler(CPU Profiler、Memory Profiler、Energy Profiler),iOS 开发者有 Xcode Instruments(Allocations、Leaks、Time Profiler),而 HarmonyOS NEXT 则为开发者提供了 @ohos.hidebug——一个轻量级的、可在应用运行时直接调用的进程级性能诊断 API 集合。
与需要 USB 连接 PC 的 IDE Profiler 不同,hidebug 可以直接在应用代码中采集数据——这对没有 DevEco Studio 环境的真机调试场景尤为实用。你可以在关键页面注入几行 hidebug 代码,让 QA 或 PM 在测试板上实时查看内存/CPU 数据;也可以在怀疑内存泄漏时定时采样并记录快照,离线分析趋势。
本文构建一个完整的"性能诊断中心"页面,把 @ohos.hidebug 的核心 API 逐一实用化演示,同时讲解 bigint 类型在格式化显示时的处理要点。
全文含完整可运行代码,适合需要对应用运行时性能数据(内存/CPU)进行程序化采集的中级开发者。
一、@ohos.hidebug 概述
1.1 什么是 hidebug
@ohos.hidebug 是 HarmonyOS 的运行时诊断模块,属于 @kit.PerformanceAnalysisKit。它提供两类核心能力:
- Native 堆内存查询:获取当前进程的 Native 堆分配情况,包括总空间、已分配大小和空闲大小。
- 进程级内存统计:从
/proc/[pid]/smaps中采集 PSS(Proportional Set Size)、VSS(Virtual Set Size)、Shared Dirty 和 Private Dirty 等指标。 - CPU 使用率:获取该进程自启动以来的总体 CPU 时间占比。
所有内存相关 API 的返回值类型都是 bigint(ES2020 引入的大整数类型),而非 number。这是 hidebug 与许多其他 HarmonyOS API 的一个重要区别——bigint 不能直接参与 number 的数学运算,也不能直接用 .toFixed() 格式化。
1.2 导入方式
import hidebug from '@ohos.hidebug';
这是 default import,不是 named import。hidebug 虽然属于 @kit.PerformanceAnalysisKit,但直接 import 自 @ohos.hidebug 即可。
1.3 核心 API 一览
| API | 返回值类型 | 单位 | 说明 |
|---|---|---|---|
getNativeHeapSize() | bigint | 字节 | Native 堆总空间 |
getNativeHeapAllocatedSize() | bigint | 字节 | Native 堆已分配大小 |
getNativeHeapFreeSize() | bigint | 字节 | Native 堆空闲大小 |
getPss() | bigint | KB | 进程 PSS(实际物理内存) |
getVss() | bigint | KB | 进程 VSS(虚拟内存) |
getSharedDirty() | bigint | KB | 共享脏页大小 |
getPrivateDirty() | bigint | KB | 私有脏页大小 |
getCpuUsage() | number | 0~1 比例 | 该进程 CPU 时间占比 |
注意:getNativeHeap* 三个 API 返回的单位是 字节,而 getPss/getVss/getSharedDirty/getPrivateDirty 返回的单位是 KB。这在 UI 展示时需要用不同的格式化策略——字节需要除以 1024 来得到 KB,而 KB 值可以直接显示或进一步转换为 MB。
getCpuUsage() 返回一个 0~1 的浮点数,表示该进程自启动以来的 CPU 时间除以总的 CPU 时间。在真机上,这个值通常在 0.01(1%)以下,除非应用正在执行密集计算。
二、bigint 格式化:从原始数据到用户可读的显示
2.1 问题
hidebug 的内存 API 返回 bigint 类型。在 ArkTS 中,你不能直接对 bigint 调用 .toFixed() 或使用 / 1024 这样的浮点除法——bigint 不能与 number 混合运算。
2.2 解决方案
核心思路是:先将 bigint 转为 number,再进行格式化操作。因为进程内存值通常在几 MB 到几百 MB 之间,完全在 number 的安全整数范围(约 9PB)内,不会出现精度丢失。
// 格式化字节值(getNativeHeap* API 的返回值)
private formatBytes(size: bigint): string {
  const b: number = Number(size);
  if (b < 1024) {
    return b.toFixed(0) + ' B';
  }
  const kb: number = b / 1024;
  if (kb < 1024) {
    return kb.toFixed(1) + ' KB';
  }
  const mb: number = kb / 1024;
  if (mb < 1024) {
    return mb.toFixed(2) + ' MB';
  }
  const gb: number = mb / 1024;
  return gb.toFixed(2) + ' GB';
}

// 格式化 KB 值(getPss/getVss 等 API 的返回值)
private formatKB(size: bigint): string {
  const kb: number = Number(size);
  if (kb < 1024) {
    return kb.toFixed(0) + ' KB';
  }
  const mb: number = kb / 1024;
  if (mb < 1024) {
    return mb.toFixed(2) + ' MB';
  }
  const gb: number = mb / 1024;
  return gb.toFixed(2) + ' GB';
}
两个格式化函数的核心区别在于起始单位:formatBytes 的入参单位是字节,需先除以 1024 得到 KB;而 formatKB 的入参已经是 KB,直接判断是否超出 1024 来升级到 MB。两者共用一套阈值阶梯(1024 → MB,1024² → GB),保证了大值和小值都有合适的显示精度。
三、实战:性能诊断中心页面
3.1 整体设计
页面分为五个功能区域:
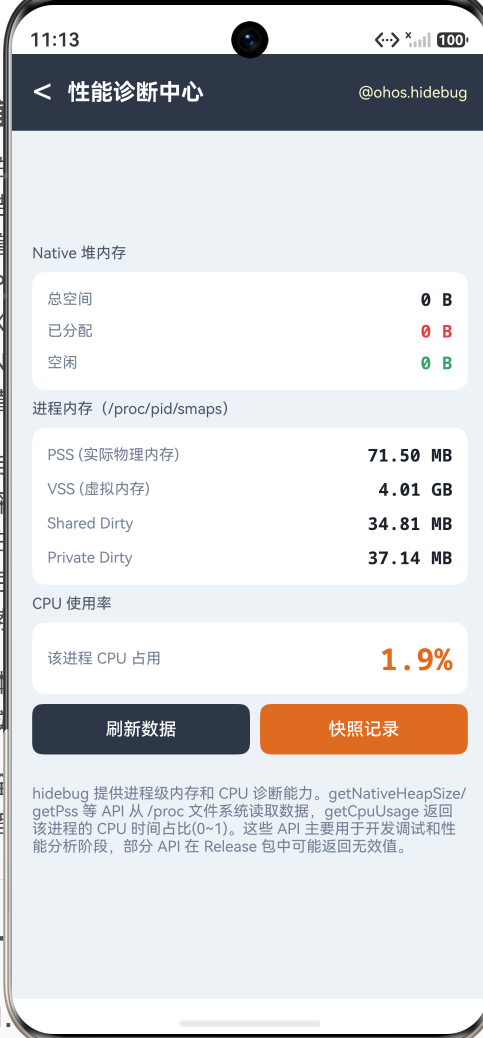
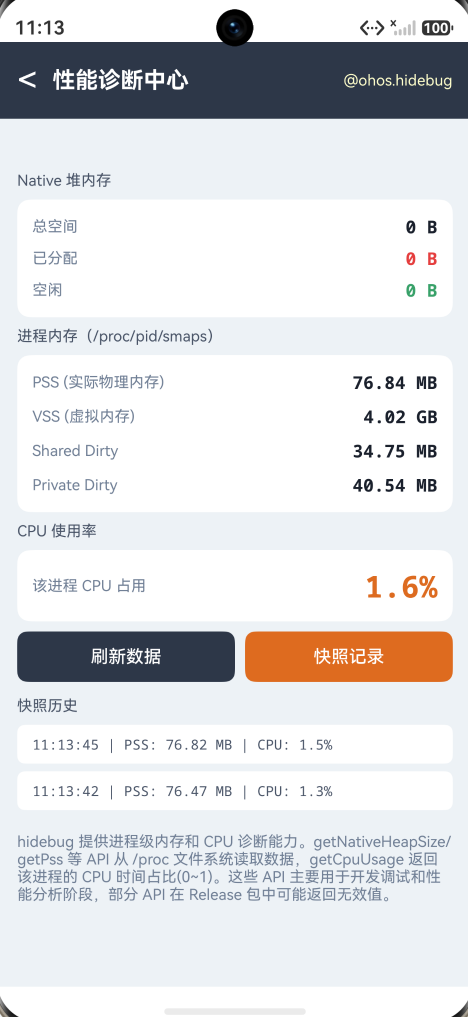
- Native 堆内存卡片:显示总空间、已分配(红色高亮)、空闲(绿色高亮)三项指标
- 进程内存卡片:显示 PSS、VSS、Shared Dirty、Private Dirty 四项指标
- CPU 使用率卡片:大字号显示当前 CPU 占比
- 操作按钮:刷新数据(重新读取所有 API)+ 快照记录(保存当前 PSS 和 CPU 到历史列表)
- 快照历史列表:最多保留 20 条,最新的排在最前
3.2 完整代码
import { router } from '@kit.ArkUI';
import hidebug from '@ohos.hidebug';
import { FontSize, Spacing } from '../common/Constants';

@Entry
@Component
struct DebugDiagnosticPage {
  @State nativeHeapSize: string = '—';
  @State nativeAllocated: string = '—';
  @State nativeFree: string = '—';
  @State pss: string = '—';
  @State vss: string = '—';
  @State sharedDirty: string = '—';
  @State privateDirty: string = '—';
  @State cpuUsage: string = '—';

  @State snapshots: string[] = [];

  private formatKB(size: bigint): string {
    const kb: number = Number(size);
    if (kb < 1024) {
      return kb.toFixed(0) + ' KB';
    }
    const mb: number = kb / 1024;
    if (mb < 1024) {
      return mb.toFixed(2) + ' MB';
    }
    const gb: number = mb / 1024;
    return gb.toFixed(2) + ' GB';
  }

  private formatBytes(size: bigint): string {
    const b: number = Number(size);
    if (b < 1024) {
      return b.toFixed(0) + ' B';
    }
    const kb: number = b / 1024;
    if (kb < 1024) {
      return kb.toFixed(1) + ' KB';
    }
    const mb: number = kb / 1024;
    if (mb < 1024) {
      return mb.toFixed(2) + ' MB';
    }
    const gb: number = mb / 1024;
    return gb.toFixed(2) + ' GB';
  }

  private refreshData(): void {
    try {
      this.nativeHeapSize = this.formatBytes(hidebug.getNativeHeapSize());
      this.nativeAllocated = this.formatBytes(hidebug.getNativeHeapAllocatedSize());
      this.nativeFree = this.formatBytes(hidebug.getNativeHeapFreeSize());
      this.pss = this.formatKB(hidebug.getPss());
      this.vss = this.formatKB(hidebug.getVss());
      this.sharedDirty = this.formatKB(hidebug.getSharedDirty());
      this.privateDirty = this.formatKB(hidebug.getPrivateDirty());
      this.cpuUsage = (hidebug.getCpuUsage() * 100).toFixed(1) + '%';
    } catch (e) {
      // 部分 API 在不支持的设备/版本上可能抛异常
    }
  }

  private takeSnapshot(): void {
    const now: Date = new Date();
    const ts: string = now.getHours().toString().padStart(2, '0') + ':' +
      now.getMinutes().toString().padStart(2, '0') + ':' +
      now.getSeconds().toString().padStart(2, '0');
    const pssKB: number = Number(hidebug.getPss());
    const pssStr: string = (pssKB / 1024).toFixed(2) + ' MB';
    const cpuStr: string = (hidebug.getCpuUsage() * 100).toFixed(1) + '%';
    const entry: string = ts + ' | PSS: ' + pssStr + ' | CPU: ' + cpuStr;
    this.snapshots = [entry].concat(this.snapshots).slice(0, 20);
  }

  aboutToAppear(): void {
    this.refreshData();
  }

  build() {
    Column() {
      // 标题栏
      Row() {
        Text('<')
          .fontSize(28)
          .fontColor('#FFFFFF')
          .onClick(() => { router.back(); })
        Text('性能诊断中心')
          .fontSize(FontSize.TITLE)
          .fontColor('#FFFFFF')
          .fontWeight(FontWeight.Bold)
          .margin({ left: Spacing.MD })
        Blank()
        Text('@ohos.hidebug')
          .fontSize(FontSize.CAPTION)
          .fontColor('#FFFFFFCC')
      }
      .width('100%')
      .padding({ left: Spacing.LG, right: Spacing.LG, top: 14, bottom: 14 })
      .backgroundColor('#2D3748')

      Scroll() {
        Column() {
          // Native 堆内存
          Text('Native 堆内存')
            .fontSize(FontSize.CAPTION)
            .fontColor('#4A5568')
            .width('100%')
            .margin({ bottom: 8 })

          Column() {
            Row() {
              Text('总空间').fontSize(FontSize.CAPTION).fontColor('#718096').layoutWeight(1)
              Text(this.nativeHeapSize)
                .fontSize(FontSize.BODY).fontFamily('monospace')
                .fontColor('#1A202C').fontWeight(FontWeight.Bold)
            }
            .width('100%').margin({ bottom: 6 })

            Row() {
              Text('已分配').fontSize(FontSize.CAPTION).fontColor('#718096').layoutWeight(1)
              Text(this.nativeAllocated)
                .fontSize(FontSize.BODY).fontFamily('monospace')
                .fontColor('#E53E3E').fontWeight(FontWeight.Bold)
            }
            .width('100%').margin({ bottom: 6 })

            Row() {
              Text('空闲').fontSize(FontSize.CAPTION).fontColor('#718096').layoutWeight(1)
              Text(this.nativeFree)
                .fontSize(FontSize.BODY).fontFamily('monospace')
                .fontColor('#38A169').fontWeight(FontWeight.Bold)
            }
            .width('100%')
          }
          .width('100%').padding(Spacing.MD)
          .backgroundColor('#FFFFFF').borderRadius(10)
          .margin({ bottom: Spacing.SM })

          // 进程内存(/proc/pid/smaps)
          Text('进程内存(/proc/pid/smaps)')
            .fontSize(FontSize.CAPTION).fontColor('#4A5568')
            .width('100%').margin({ bottom: 8 })

          Column() {
            Row() {
              Text('PSS (实际物理内存)').fontSize(FontSize.CAPTION).fontColor('#718096').layoutWeight(1)
              Text(this.pss)
                .fontSize(FontSize.BODY).fontFamily('monospace')
                .fontColor('#1A202C').fontWeight(FontWeight.Bold)
            }
            .width('100%').margin({ bottom: 8 })

            Row() {
              Text('VSS (虚拟内存)').fontSize(FontSize.CAPTION).fontColor('#718096').layoutWeight(1)
              Text(this.vss)
                .fontSize(FontSize.BODY).fontFamily('monospace')
                .fontColor('#1A202C').fontWeight(FontWeight.Bold)
            }
            .width('100%').margin({ bottom: 8 })

            Row() {
              Text('Shared Dirty').fontSize(FontSize.CAPTION).fontColor('#718096').layoutWeight(1)
              Text(this.sharedDirty)
                .fontSize(FontSize.BODY).fontFamily('monospace')
                .fontColor('#1A202C').fontWeight(FontWeight.Bold)
            }
            .width('100%').margin({ bottom: 8 })

            Row() {
              Text('Private Dirty').fontSize(FontSize.CAPTION).fontColor('#718096').layoutWeight(1)
              Text(this.privateDirty)
                .fontSize(FontSize.BODY).fontFamily('monospace')
                .fontColor('#1A202C').fontWeight(FontWeight.Bold)
            }
            .width('100%')
          }
          .width('100%').padding(Spacing.MD)
          .backgroundColor('#FFFFFF').borderRadius(10)
          .margin({ bottom: Spacing.SM })

          // CPU 使用率
          Text('CPU 使用率')
            .fontSize(FontSize.CAPTION).fontColor('#4A5568')
            .width('100%').margin({ bottom: 8 })

          Column() {
            Row() {
              Text('该进程 CPU 占用').fontSize(FontSize.CAPTION).fontColor('#718096').layoutWeight(1)
              Text(this.cpuUsage)
                .fontSize(24).fontFamily('monospace')
                .fontColor('#DD6B20').fontWeight(FontWeight.Bold)
            }
            .width('100%')
          }
          .width('100%').padding(Spacing.MD)
          .backgroundColor('#FFFFFF').borderRadius(10)
          .margin({ bottom: Spacing.SM })

          // 操作按钮
          Row() {
            Button('刷新数据')
              .fontSize(FontSize.BODY).fontColor('#FFFFFF')
              .height(40).borderRadius(8)
              .backgroundColor('#2D3748').layoutWeight(1)
              .onClick(() => { this.refreshData(); })

            Button('快照记录')
              .fontSize(FontSize.BODY).fontColor('#FFFFFF')
              .height(40).borderRadius(8)
              .backgroundColor('#DD6B20').layoutWeight(1)
              .margin({ left: Spacing.SM })
              .onClick(() => { this.takeSnapshot(); })
          }
          .width('100%').margin({ bottom: Spacing.MD })

          // 快照历史
          if (this.snapshots.length > 0) {
            Text('快照历史')
              .fontSize(FontSize.CAPTION).fontColor('#4A5568')
              .width('100%').margin({ bottom: 8 })

            ForEach(this.snapshots, (s: string) => {
              Text(s)
                .fontSize(11).fontFamily('monospace').fontColor('#4A5568')
                .width('100%')
                .padding({ left: Spacing.MD, right: Spacing.MD, top: 8, bottom: 8 })
                .backgroundColor('#FFFFFF').borderRadius(6)
                .margin({ bottom: 6 })
            })
          }

          Text('hidebug 提供进程级内存和 CPU 诊断能力。getNativeHeapSize/getPss 等 API 从 /proc 文件系统读取数据,getCpuUsage 返回该进程的 CPU 时间占比(0~1)。这些 API 主要用于开发调试和性能分析阶段,部分 API 在 Release 包中可能返回无效值。')
            .fontSize(FontSize.CAPTION).fontColor('#718096')
            .width('100%')
            .margin({ top: Spacing.MD, bottom: Spacing.XXL })
        }
        .width('100%')
        .padding({ left: Spacing.LG, right: Spacing.LG, top: Spacing.MD, bottom: Spacing.MD })
      }
      .layoutWeight(1).scrollBar(BarState.Off).backgroundColor('#EDF2F7')
    }
    .width('100%').height('100%').backgroundColor('#EDF2F7')
  }
}
3.3 代码结构解析
状态设计
页面定义了 8 个显示状态变量(nativeHeapSize 到 cpuUsage),初始化值为 '—',表示尚未获取数据。aboutToAppear() 在页面进入时调用 refreshData() 获取首次数据并更新所有状态。
snapshots 是一个 string[] 数组,存储每次手动快照的文本摘要。使用 concat 将新条目插入头部,然后用 slice(0, 20) 限制最多 20 条,防止无限增长。
refreshData() — 数据采集
refreshData() 依次调用 8 个 hidebug API,将结果格式化后赋给对应的状态变量。外层包裹 try-catch,因为部分 API 在特定设备或系统版本上可能不可用。
关键细节:getNativeHeap* 系列 API 使用 formatBytes()(入参为字节),而 getPss/getVss/getSharedDirty/getPrivateDirty 使用 formatKB()(入参为 KB)。搞混这两类 API 的单位会导致数值偏差 1024 倍。
takeSnapshot() — 快照记录
takeSnapshot() 先获取当前时间戳(时:分:秒),再重新读取 PSS 和 CPU 值,拼接成一条 "HH:MM:SS | PSS: XX MB | CPU: X.X%" 格式的快照文本,插入 snapshots 头部。
这里没有复用 this.pss 和 this.cpuUsage 状态值,而是直接重新调用 hidebug.getPss() 和 hidebug.getCpuUsage(),确保快照数据是"此时此刻"的精确读数,而非上一次刷新缓存的状态值。
UI 构建
标题栏的背景色 #2D3748 是深灰蓝,比纯黑更柔和。Native 堆"已分配"使用红色 #E53E3E 突出内存压力,"空闲"使用绿色 #38A169 传达正向信息。CPU 使用率使用大号字体(24fp)和橙色 #DD6B20 强调。两个操作按钮并排各占 50% 宽度(layoutWeight(1)),“快照记录"按钮使用橙色背景,在视觉上区分"一般操作"和"关键操作”。
四、内存指标解读:从 PSS 到 Private Dirty
4.1 PSS(Proportional Set Size — 比例分配物理内存)
PSS 是最接近"该进程实际占用了多少物理内存"的指标。共享库(如系统 so 文件)的内存被所有使用它的进程按比例分摊。例如,一个 100KB 的共享库被 5 个进程使用,每个进程的 PSS 只计入 20KB。
这是 Android 和 HarmonyOS 底层(通过 /proc/[pid]/smaps_rollup)都支持的指标,也是 dumpsys meminfo 中最受关注的数据。在 HarmonyOS 中,hidebug.getPss() 直接返回该值。
4.2 VSS(Virtual Set Size — 虚拟内存大小)
VSS 是进程已申请的虚拟地址空间总量,包括已映射但未实际分配的地址、共享库的完整大小等。VSS 通常远大于 PSS(可能高出数十倍甚至上百倍),它不反映实际物理内存消耗,但在诊断"虚拟地址空间耗尽"问题时有用。
4.3 Shared Dirty vs Private Dirty
"脏页(Dirty Page)"是指被进程修改过、尚未写回磁盘的内存页面。
- Shared Dirty:被多个进程共同修改的脏页。如果该进程退出,这些页面不能被直接回收——因为其他进程还在引用它们。
- Private Dirty:该进程独占的脏页。进程退出时,这些页面可以被系统安全回收。
Private Dirty 的增长是内存泄漏的主要信号之一。如果你在应用中反复进入/退出某个页面,Private Dirty 持续增长而不回落,就需要排查是否有对象未被 GC 回收或 Native 层未释放资源。
4.4 Native 堆
getNativeHeapSize/getNativeHeapAllocatedSize/getNativeHeapFreeSize 返回的是 Native 层(C/C++ 侧)通过 malloc/new 分配的内存情况。ArkTS 侧的对象由 ArkCompiler 的 GC 管理,不在这三个 API 的统计范围内。
这三者满足关系:总空间 = 已分配 + 空闲 + 内部碎片。如果"已分配 / 总空间"的比值持续升高且空闲空间很少,说明 Native 堆可能接近上限,有 OOM 风险。
五、CPU 使用率的正确打开方式
5.1 getCpuUsage() 的含义
hidebug.getCpuUsage() 返回一个 0~1 的浮点数,表示:
该进程自启动以来消耗的 CPU 时间 / 自启动以来系统总的 CPU 时间
注意两点:
- 这是一个累积值,不是瞬时值。进程刚启动时,这个值非常接近 0(因为分母是系统总运行时间,而分子是进程仅启动后的 CPU 时间)。
- 它是所有核心的合计。在多核设备上,如果一个进程在两个核心上各满负载运行了 1 秒,它的 CPU 时间就是 2 秒。
5.2 实际使用场景
在真机上,一个空闲的前台 ArkUI 应用,getCpuUsage() 通常在 0.1%~1% 之间。如果发现持续在 5% 以上,说明有后台计算或动画循环在持续消耗 CPU。
建议在以下场景采集 CPU 数据:
- 列表滚动前后对比
- 页面切换前后对比
- 大文件读写前后对比
- 图片解码前后对比
5.3 近似瞬时值
如果需要近似瞬时的 CPU 使用率,可以记录两次采样之间的差值:
private prevCpuTime: number = 0;
private prevWallTime: number = 0;

getCpuInstant(): number {
  const currentCpu: number = hidebug.getCpuUsage(); // 这是比例,不是绝对值
  // hidebug 没有直接暴露 CPU 时间绝对值,所以无法精确计算瞬时值
  // 但可以通过观察 getCpuUsage() 的增速间接判断
  // 例如:每 5 秒采样一次,如果每次增长 > 0.01%,说明有持续 CPU 消耗
  const delta: number = currentCpu - this.prevCpuTime;
  this.prevCpuTime = currentCpu;
  return delta;
}
需要指出的是,hidebug 没有提供类似 /proc/[pid]/stat 中的 utime/stime 绝对值接口,因此无法像 Android 的 top 命令那样精确计算瞬时 CPU 使用率。getCpuUsage() 更适用于"这个进程从启动到现在,总共吃了多少 CPU"的宏观判断。
六、几个关键实战要点
6.1 bigint 不能隐式转换
在 ArkTS 中,bigint 类型与 number 类型之间没有隐式转换。以下代码会报错:
const pss: bigint = hidebug.getPss();
const pssMB: number = pss / 1024; // 编译错误!bigint 不能与 number 做除法
正确做法是先用 Number() 显式转换:
const pssMB: number = Number(pss) / 1024; // 正确
6.2 部分 API 在 Release 包中返回 0
hidebug 主要用于开发调试和性能分析。在 Release 编译模式下,部分 API 可能返回 0 或无效值(这是系统为了安全性和性能的有意行为)。依赖 hidebug 做线上监控需要先在真机 Release 包上验证可用性。
6.3 getCpuUsage 返回的不是百分比
getCpuUsage() 返回的是 0~1 的比例值,不是百分比。乘以 100 才能得到 "X.X%" 格式的字符串。这很容易在 UI 层直接展示原始值时被误解——显示 0.02 实际上意味着 2%,而不是 0.02%。
6.4 单位混淆陷阱
前面已提到,getNativeHeap* 返回字节,getPss* 返回 KB。但在实际开发中,还有一个容易被忽略的陷阱:
// getNativeHeapSize 返回字节
const heapBytes: bigint = hidebug.getNativeHeapSize();
// getPss 返回 KB
const pssKB: bigint = hidebug.getPss();
// 如果交换了格式化函数,结果会完全错误:
// 实际 100KB 的 PSS,若错误使用 formatBytes,会显示 "0.10 KB"(实际是 100KB)
// 实际 100MB 的 Native Heap,若错误使用 formatKB,会显示 "102400 KB"(实际是 102.4MB)
建议在 Variable 命名时加上后缀提示(如 pssKB 而不是 pss),减少上下文切换时的出错概率。
七、快照功能的实践价值
7.1 为什么需要快照
实时数据只能告诉你"现在是什么状态",但无法回答"5 分钟前是什么状态"或"翻页之后变了吗"。快照功能让开发者可以:
- 对比操作前后的内存差异:进入页面 → 拍快照 → 执行操作 → 再拍快照 → 对比 PSS
- 检测是否有内存泄漏:每 30 秒拍一张快照,如果 PSS 持续增长不回落,说明可能存在泄漏
- 定位 CPU 瓶颈:在不同任务阶段拍快照,观察哪个阶段 CPU 占用最高
7.2 快照的数据结构
本文的实现是最简版——每条快照只有时间戳 + PSS + CPU。在实际工程中,你可以扩展快照结构包含更多维度:
interface DiagnosticSnapshot {
  timestamp: number;
  pssKB: number;
  vssKB: number;
  nativeHeapAllocated: number;
  nativeHeapFree: number;
  sharedDirty: number;
  privateDirty: number;
  cpuUsage: number;
  label?: string; // 可选标注,如 "进入首页"、"视频播放中"
}
然后用 @ohos.data.relationalStore 或 @ohos.data.preferences 将快照持久化到本地,供离线分析。
7.3 快照数量控制
本文限制 20 条快照。这个数字是内存友好和追溯能力之间的平衡——20 条足够覆盖一次典型的性能测试(如 5 分钟、每 15 秒一张),且每条快照只是几十字节的字符串,内存占用微不足道。
八、与其它诊断工具的配合
hidebug 不是一个"万能"的性能诊断工具。它侧重于内存和 CPU 的基本查询,不具备以下能力:
- 内存分配追踪(Allocation Tracking):不能告诉你"是哪个函数分配了这块内存"——需要
@ohos.hidebug的更高阶 API 或 DevEco Studio Profiler - CPU 火焰图(Flame Graph):不能告诉你"CPU 时间花在了哪个函数上"——需要
@ohos.hilog埋点或 Profiler - GC 行为分析:不能直接查询 ArkCompiler GC 的暂停时间和频率
因此,hidebug 的最佳定位是:应用内实时数据采集 + 粗粒度性能排查。它和 DevEco Studio Profiler 是互补关系:
- 用 hidebug 在真机上快速确认"确实有性能问题"
- 连上 DevEco Studio 用 Profiler 精确定位问题根源
九、小结
本文以"性能诊断中心"为 Demo,系统性讲解了 HarmonyOS NEXT 的 @ohos.hidebug:
- 核心 API 分类:Native 堆内存三件套(getNativeHeapSize/Allocated/Free,单位字节)+ 进程内存四件套(getPss/getVss/getSharedDirty/getPrivateDirty,单位 KB)+ CPU 使用率(getCpuUsage,0~1 比例值)
- bigint 处理:所有内存 API 返回
bigint,必须用Number()显式转换后才能参与浮点运算和格式化 - 单位区分:字节 vs KB 两个格式化函数,混用会导致千倍偏差
- 快照机制:定时采样的时间戳 + PSS + CPU 摘要,用于离线趋势分析
- 内存指标语义:PSS(按比例分摊的真正物理内存开销)、Private Dirty(进程独占脏页,内存泄漏的观察窗口)
- CPU 语义:getCpuUsage 是进程自启动以来的累积 CPU 时间占比,非瞬时值
- 使用边界:部分 API 在 Release 包中可能无效;不能替代 Profiler 的精确定位能力
hidebug 是开发者对应用运行时健康的"自检镜"——不需要外接工具,几行代码就能在真机上随时查看进程的内存/CPU 快照。下一次当你的 QA 拿着测试机说"这个版本好像有点卡"时,把性能诊断中心页面打开,截一张 PSS 和 CPU 的快照,让数据说话。

作为“人工智能6S店”的官方数字引擎,为AI开发者与企业提供一个覆盖软硬件全栈、一站式门户。
更多推荐


 5
5 0
0- 0


 已为社区贡献286条内容

所有评论(0)