
Flutter 框架跨平台鸿蒙开发 - 消费热力图
运行效果图消费热力图是一款个人财务管理可视化应用,通过直观的热力图展示用户的消费分布情况。应用将消费数据按时间维度和类别维度进行可视化呈现,让用户一目了然地了解自己的钱都花在了哪里。通过日历热力图、类别热力图、饼图、趋势图等多种可视化方式,帮助用户发现消费规律,优化支出结构。应用以珊瑚红为主色调,营造温馨而不失警示感的视觉体验。涵盖概览统计、热力图展示、消费分析、明细记录四大模块,支持9种消费分类
消费热力图应用
欢迎加入开源鸿蒙跨平台社区:
https://openharmonycrossplatform.csdn.net
一、项目概述
运行效果图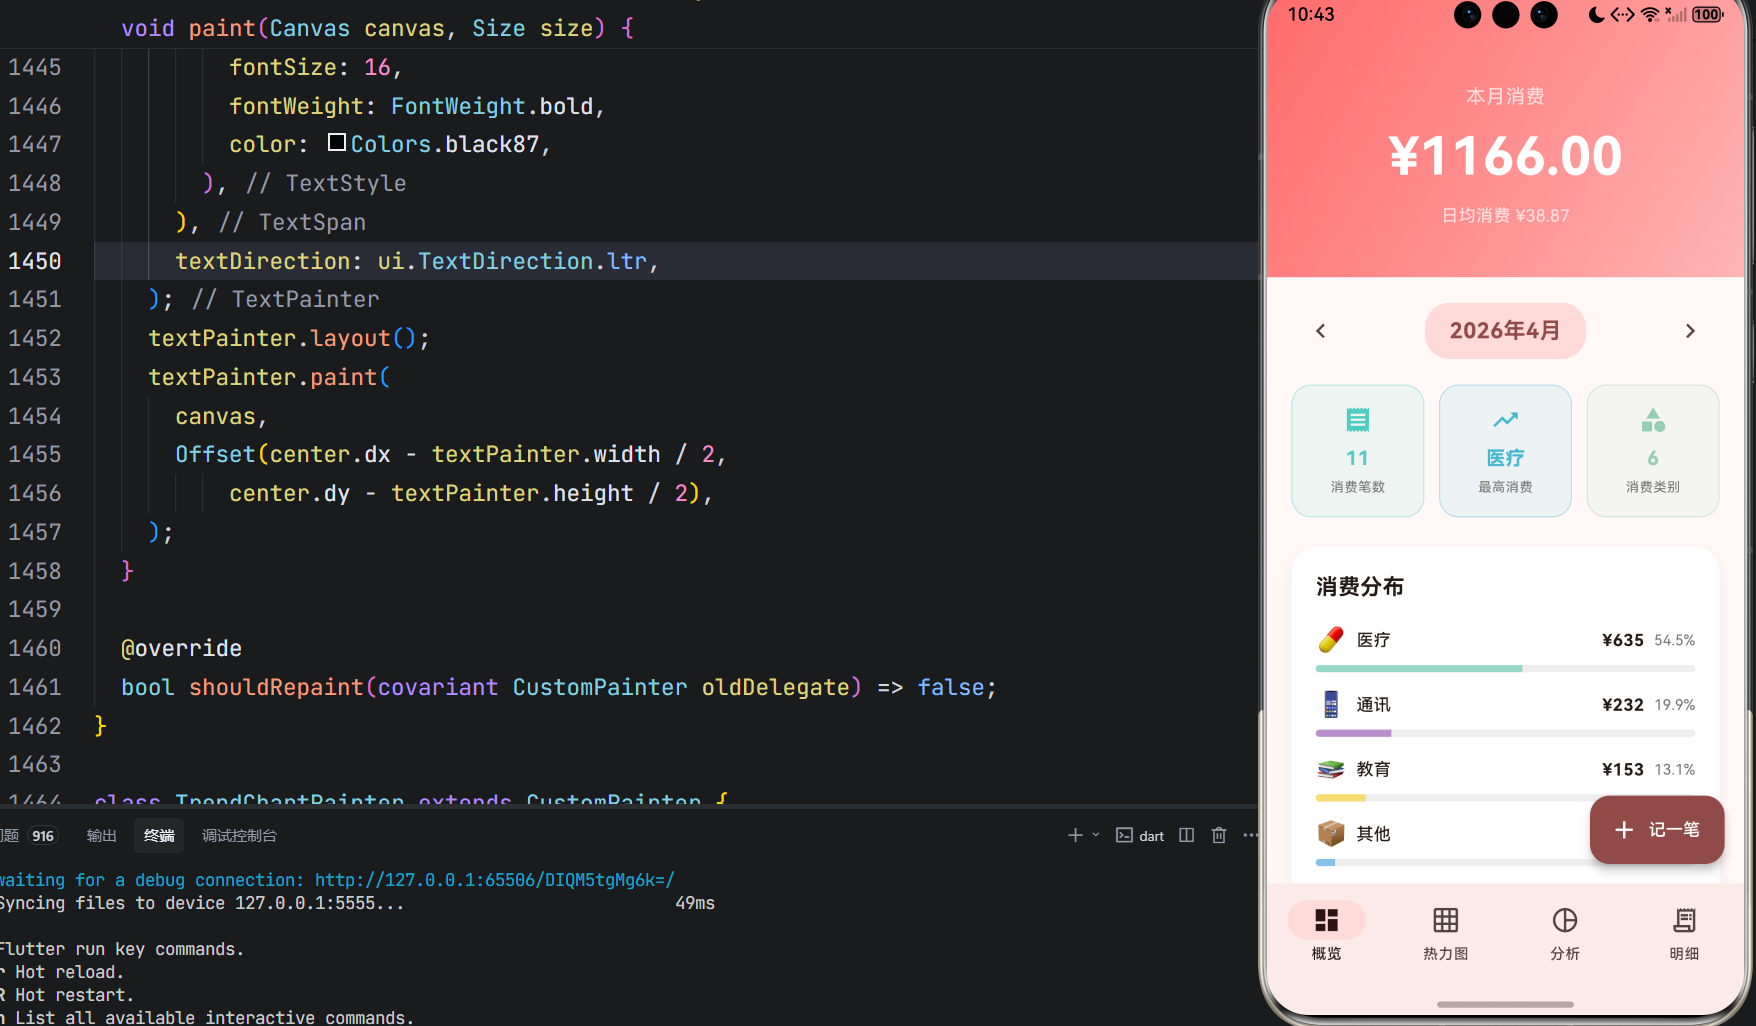
1.1 应用简介
消费热力图是一款个人财务管理可视化应用,通过直观的热力图展示用户的消费分布情况。应用将消费数据按时间维度和类别维度进行可视化呈现,让用户一目了然地了解自己的钱都花在了哪里。通过日历热力图、类别热力图、饼图、趋势图等多种可视化方式,帮助用户发现消费规律,优化支出结构。
应用以珊瑚红为主色调,营造温馨而不失警示感的视觉体验。涵盖概览统计、热力图展示、消费分析、明细记录四大模块,支持9种消费分类和多种时间粒度查看,通过智能洞察提供个性化的理财建议。
1.2 核心功能
| 功能模块 | 功能描述 | 实现方式 |
|---|---|---|
| 概览统计 | 月度消费总览 | CustomScrollView |
| 热力图 | 日消费热力展示 | GridView网格 |
| 消费分析 | 饼图+趋势分析 | CustomPainter |
| 明细记录 | 消费记录列表 | ListView |
| 添加记录 | 新增消费记录 | ModalBottomSheet |
| 筛选功能 | 按类别筛选 | FilterChip |
1.3 消费分类系统
| 序号 | 类别名称 | Emoji | 颜色 | 典型消费 |
|---|---|---|---|---|
| 1 | 餐饮 | 🍔 | #FF6B6B | 早餐、午餐、晚餐、外卖 |
| 2 | 交通 | 🚗 | #4ECDC4 | 地铁、公交、打车、加油 |
| 3 | 购物 | 🛍️ | #45B7D1 | 日用品、服装、数码产品 |
| 4 | 娱乐 | 🎮 | #96CEB4 | 电影、KTV、游戏、旅游 |
| 5 | 住房 | 🏠 | #DDA0DD | 房租、水电费、物业费 |
| 6 | 医疗 | 💊 | #98D8C8 | 药品、体检、挂号 |
| 7 | 教育 | 📚 | #F7DC6F | 书籍、课程、培训 |
| 8 | 通讯 | 📱 | #BB8FCE | 话费、网费、会员 |
| 9 | 其他 | 📦 | #85C1E9 | 红包、礼物、杂项 |
1.4 时间粒度
| 粒度 | 标签 | 描述 |
|---|---|---|
| 日 | 日 | 按日查看消费热力图 |
| 周 | 周 | 按周汇总消费数据 |
| 月 | 月 | 按月汇总消费数据 |
1.5 热力图等级
| 等级 | 颜色 | 消费强度 |
|---|---|---|
| 0 | #E0E0E0 | 无消费 |
| 1 | #FFE5E5 | 低消费 |
| 2 | #FFB4B4 | 中低消费 |
| 3 | #FF8E8E | 中高消费 |
| 4 | #FF6B6B | 高消费 |
1.6 技术栈
| 技术领域 | 技术选型 | 版本要求 |
|---|---|---|
| 开发框架 | Flutter | >= 3.0.0 |
| 编程语言 | Dart | >= 2.17.0 |
| 设计规范 | Material Design 3 | - |
| 图表绘制 | CustomPainter | - |
| 动画控制 | AnimationController | - |
| 日期格式化 | intl | - |
| 目标平台 | 鸆蒙OS / Web | API 21+ |
1.7 项目结构
lib/
└── main_spending_heatmap.dart
├── SpendingHeatmapApp # 应用入口
├── SpendingCategory # 消费分类枚举
├── TimeGranularity # 时间粒度枚举
├── SpendingRecord # 消费记录数据模型
├── DailySpending # 日消费汇总模型
├── SpendingHeatmapHomePage # 主页面(底部导航)
├── _buildOverviewPage # 概览页面
├── _buildHeatmapPage # 热力图页面
├── _buildAnalysisPage # 分析页面
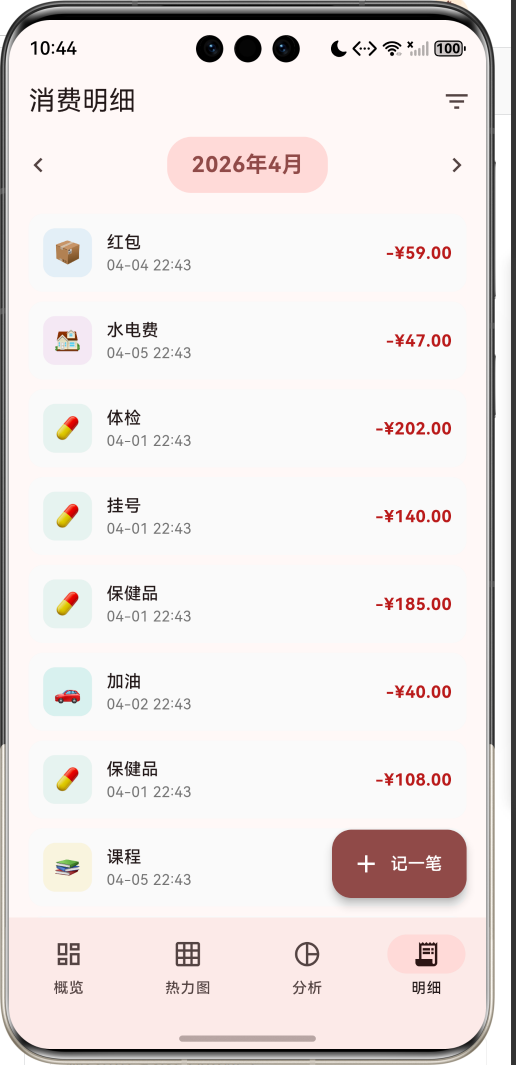
├── _buildRecordsPage # 明细页面
├── _AddRecordSheet # 添加记录弹窗
├── PieChartPainter # 饼图绘制器
└── TrendChartPainter # 趋势图绘制器
二、系统架构
2.1 整体架构图
2.2 类图设计
2.3 页面导航流程
2.4 数据流向图
三、核心模块设计
3.1 数据模型设计
3.1.1 消费分类枚举 (SpendingCategory)
enum SpendingCategory {
  food('餐饮', '🍔', Color(0xFFFF6B6B)),
  transport('交通', '🚗', Color(0xFF4ECDC4)),
  shopping('购物', '🛍️', Color(0xFF45B7D1)),
  entertainment('娱乐', '🎮', Color(0xFF96CEB4)),
  housing('住房', '🏠', Color(0xFFDDA0DD)),
  health('医疗', '💊', Color(0xFF98D8C8)),
  education('教育', '📚', Color(0xFFF7DC6F)),
  communication('通讯', '📱', Color(0xFFBB8FCE)),
  other('其他', '📦', Color(0xFF85C1E9));

  final String label;   // 类别名称
  final String emoji;   // 代表表情
  final Color color;    // 主题颜色
}
3.1.2 时间粒度枚举 (TimeGranularity)
enum TimeGranularity {
  daily('日', '按日查看'),
  weekly('周', '按周查看'),
  monthly('月', '按月查看');

  final String label;        // 粒度标签
  final String description;  // 描述文字
}
3.1.3 消费记录模型 (SpendingRecord)
class SpendingRecord {
  final String id;              // 唯一标识
  final String title;           // 消费名称
  final double amount;          // 消费金额
  final SpendingCategory category; // 消费类别
  final DateTime date;          // 消费日期
  final String? note;           // 备注信息
}
3.1.4 日消费汇总模型 (DailySpending)
class DailySpending {
  final DateTime date;                        // 日期
  final Map<SpendingCategory, double> categoryAmounts; // 各类别金额
  final double total;                         // 总金额

  double getAmount(SpendingCategory category) {
    return categoryAmounts[category] ?? 0;
  }
}
3.1.5 消费分类分布
3.2 页面结构设计
3.2.1 主页面布局
3.2.2 概览页面结构
3.2.3 热力图页面结构
3.2.4 分析页面结构
3.3 统计计算流程
四、UI设计规范
4.1 配色方案
应用以珊瑚红为主色调,营造温馨而不失警示感的视觉体验:
| 颜色类型 | 色值 | 用途 |
|---|---|---|
| 主色 | #FF6B6B (Coral Red) | 导航、强调元素 |
| 渐变浅 | #FF8E8E | 渐变过渡 |
| 渐变淡 | #FFB4B4 | 渐变背景 |
| 背景白 | #FFFFFF | 卡片背景 |
| 文字灰 | #9E9E9E | 次要文字 |
4.2 类别配色
| 类别 | 色值 | 视觉效果 |
|---|---|---|
| 餐饮 | #FF6B6B | 温暖红色 |
| 交通 | #4ECDC4 | 清新青色 |
| 购物 | #45B7D1 | 明亮蓝色 |
| 娱乐 | #96CEB4 | 自然绿色 |
| 住房 | #DDA0DD | 柔和紫色 |
| 医疗 | #98D8C8 | 清淡绿色 |
| 教育 | #F7DC6F | 明亮黄色 |
| 通讯 | #BB8FCE | 优雅紫色 |
| 其他 | #85C1E9 | 天空蓝色 |
4.3 热力图配色
| 等级 | 色值 | 消费强度 |
|---|---|---|
| 0 | #E0E0E0 | 无消费 |
| 1 | #FFE5E5 | 低 (<25%) |
| 2 | #FFB4B4 | 中低 (25-50%) |
| 3 | #FF8E8E | 中高 (50-75%) |
| 4 | #FF6B6B | 高 (>75%) |
4.4 字体规范
| 元素 | 字号 | 字重 | 颜色 |
|---|---|---|---|
| 总消费金额 | 42px | Bold | #FFFFFF |
| 页面标题 | 20px | Bold | #000000 |
| 类别名称 | 16px | Bold | #000000 |
| 金额数值 | 14px | Bold | 类别颜色 |
| 百分比 | 12px | Regular | #9E9E9E |
| 日期 | 10px | Medium | 根据强度 |
4.5 组件规范
4.5.1 头部统计卡片
┌─────────────────────────────────────┐
│                                     │
│         本月消费                    │
│                                     │
│       ¥ 3,256.80                   │
│                                     │
│     日均消费 ¥108.56               │
│                                     │
└─────────────────────────────────────┘
4.5.2 快速统计卡片
┌──────────┐  ┌──────────┐  ┌──────────┐
│    📄    │  │    📈    │  │    📊    │
│    45    │  │   餐饮   │  │    6     │
│ 消费笔数 │  │ 最高消费 │  │ 消费类别 │
└──────────┘  └──────────┘  └──────────┘
4.5.3 消费分布条
🍔 餐饮        ████████████████████░░░░  ¥980  30.1%
🛍️ 购物        ████████████░░░░░░░░░░░░  ¥650  20.0%
🚗 交通        █████████░░░░░░░░░░░░░░░  ¥490  15.0%
🎮 娱乐        ████████░░░░░░░░░░░░░░░░  ¥390  12.0%
🏠 住房        ██████░░░░░░░░░░░░░░░░░░  ¥330  10.0%
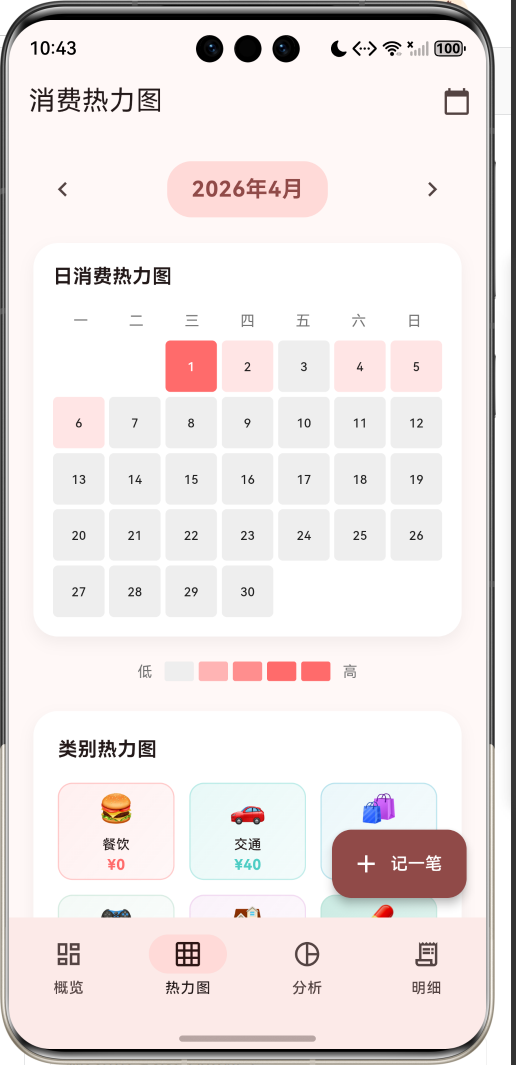
4.5.4 日历热力图
┌─────────────────────────────────────┐
│  一   二   三   四   五   六   日   │
├─────────────────────────────────────┤
│      [1]  [2]  [3]  [4]  [5]  [6]  │
│  [7]  [8]  [9] [10] [11] [12] [13] │
│ [14] [15] [16] [17] [18] [19] [20] │
│ [21] [22] [23] [24] [25] [26] [27] │
│ [28] [29] [30] [31]                │
└─────────────────────────────────────┘
  低 □□□□□ 高
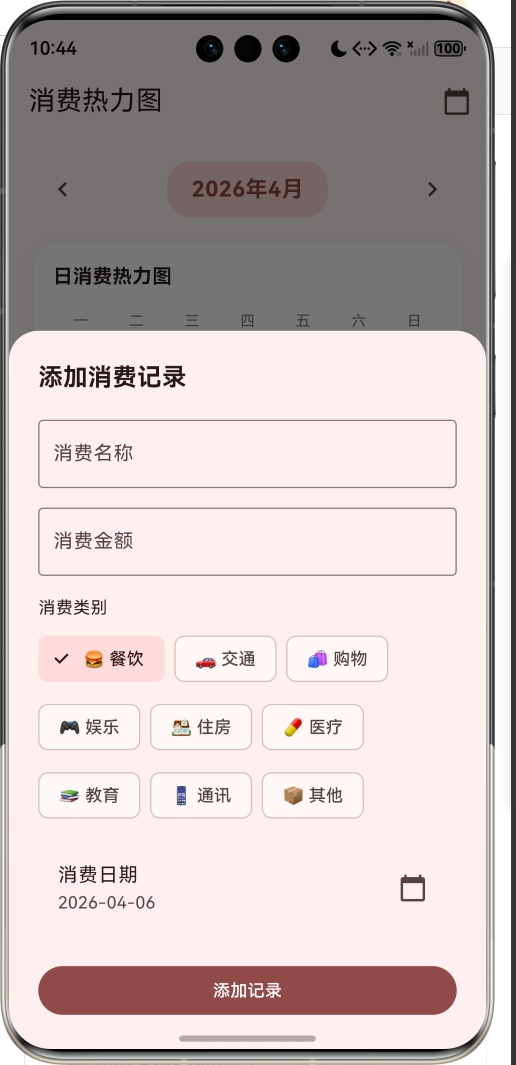
4.5.5 添加记录弹窗
┌─────────────────────────────────────┐
│  添加消费记录                       │
├─────────────────────────────────────┤
│  消费名称: [________________]       │
│  消费金额: [¥_______]               │
│                                     │
│  消费类别:                          │
│  [🍔餐饮] [🚗交通] [🛍️购物]        │
│  [🎮娱乐] [🏠住房] [💊医疗]        │
│  [📚教育] [📱通讯] [📦其他]        │
│                                     │
│  消费日期: 2024-01-15      [📅]    │
│                                     │
│  [        添加记录        ]         │
└─────────────────────────────────────┘
五、核心功能实现
5.1 统计计算实现
Map<String, dynamic> _getStatistics() {
  // 过滤当月记录
  final monthRecords = _records.where((r) =>
    r.date.year == _selectedMonth.year &&
    r.date.month == _selectedMonth.month
  ).toList();

  // 计算总消费
  final totalSpending = monthRecords.fold<double>(0, (sum, r) => sum + r.amount);

  // 计算各类别总额
  final categoryTotals = <SpendingCategory, double>{};
  for (var category in SpendingCategory.values) {
    categoryTotals[category] = monthRecords
        .where((r) => r.category == category)
        .fold<double>(0, (sum, r) => sum + r.amount);
  }

  // 计算日均消费
  final avgDaily = totalSpending / DateTime(_selectedMonth.year, _selectedMonth.month + 1, 0).day;

  // 排序类别
  final sortedCategories = categoryTotals.entries.toList()
    ..sort((a, b) => b.value.compareTo(a.value));

  return {
    'total': totalSpending,
    'avgDaily': avgDaily,
    'categoryTotals': categoryTotals,
    'sortedCategories': sortedCategories,
    'recordCount': monthRecords.length,
  };
}
5.2 热力图颜色计算
Color _getHeatmapColor(double intensity) {
  if (intensity == 0) return Colors.grey[200]!;
  if (intensity < 0.25) return const Color(0xFFFFE5E5);
  if (intensity < 0.5) return const Color(0xFFFFB4B4);
  if (intensity < 0.75) return const Color(0xFFFF8E8E);
  return const Color(0xFFFF6B6B);
}
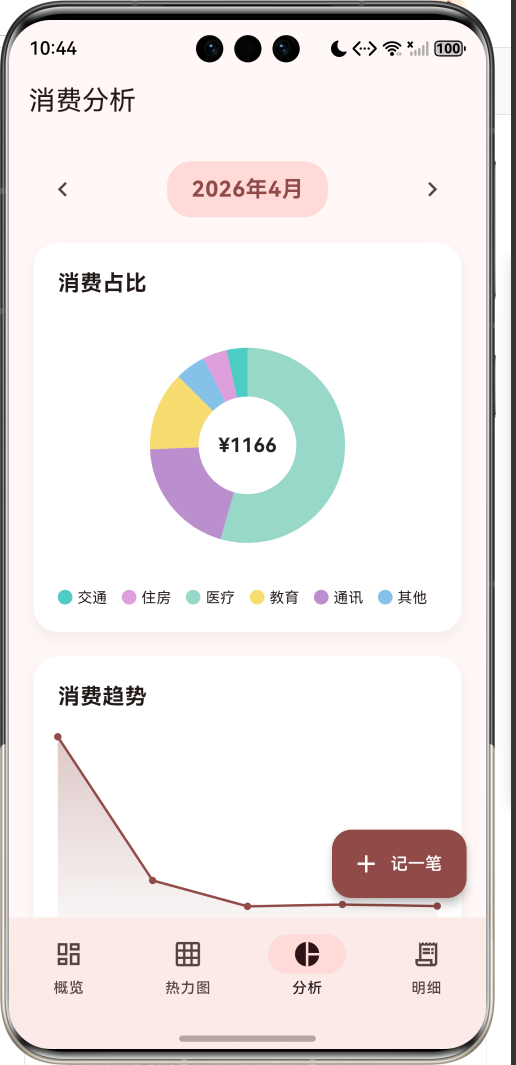
5.3 饼图绘制实现
class PieChartPainter extends CustomPainter {
final Map<SpendingCategory, double> categoryTotals;
final double total;
void paint(Canvas canvas, Size size) {
final center = Offset(size.width / 2, size.height / 2);
final radius = min(size.width, size.height) / 2 - 20;
if (total == 0) return;
double startAngle = -pi / 2;
// 按金额排序
final sortedEntries = categoryTotals.entries.toList()
..sort((a, b) => b.value.compareTo(a.value));
// 绘制各扇区
for (var entry in sortedEntries) {
if (entry.value <= 0) continue;
final sweepAngle = (entry.value / total) * 2 * pi;
final paint = Paint()
..color = entry.key.color
..style = PaintingStyle.fill;
canvas.drawArc(
Rect.fromCircle(center: center, radius: radius),
startAngle,
sweepAngle,
true,
paint,
);
startAngle += sweepAngle;
}
// 绘制中心圆(形成环形图)
canvas.drawCircle(center, radius * 0.5, Paint()..color = Colors.white);
// 绘制总金额文字
final textPainter = TextPainter(
text: TextSpan(
text: '¥${total.toStringAsFixed(0)}',
style: const TextStyle(fontSize: 16, fontWeight: FontWeight.bold),
),
textDirection: TextDirection.ltr,
);
textPainter.layout();
textPainter.paint(canvas, Offset(center.dx - textPainter.width / 2, center.dy - textPainter.height / 2));
}
}
5.4 趋势图绘制实现
class TrendChartPainter extends CustomPainter {
final List<double> data;
final double maxValue;
final Color color;
void paint(Canvas canvas, Size size) {
if (data.isEmpty) return;
final paint = Paint()
..color = color
..strokeWidth = 2
..style = PaintingStyle.stroke;
// 填充渐变
final fillPaint = Paint()
..shader = LinearGradient(
begin: Alignment.topCenter,
end: Alignment.bottomCenter,
colors: [color.withValues(alpha: 0.3), color.withValues(alpha: 0.05)],
).createShader(Rect.fromLTWH(0, 0, size.width, size.height))
..style = PaintingStyle.fill;
final path = Path();
final fillPath = Path();
final stepX = size.width / (data.length - 1);
for (int i = 0; i < data.length; i++) {
final x = i * stepX;
final y = size.height - (data[i] / maxValue) * size.height;
if (i == 0) {
path.moveTo(x, y);
fillPath.moveTo(x, size.height);
fillPath.lineTo(x, y);
} else {
path.lineTo(x, y);
fillPath.lineTo(x, y);
}
}
fillPath.lineTo(size.width, size.height);
fillPath.close();
canvas.drawPath(fillPath, fillPaint);
canvas.drawPath(path, paint);
// 绘制数据点
for (int i = 0; i < data.length; i++) {
final x = i * stepX;
final y = size.height - (data[i] / maxValue) * size.height;
canvas.drawCircle(Offset(x, y), 3, Paint()..color = color);
}
}
}
5.5 添加记录实现
void _addRecord() {
  showModalBottomSheet(
    context: context,
    isScrollControlled: true,
    shape: const RoundedRectangleBorder(
      borderRadius: BorderRadius.vertical(top: Radius.circular(24)),
    ),
    builder: (context) => _AddRecordSheet(
      onAdd: (record) {
        setState(() {
          _records.insert(0, record);
        });
      },
    ),
  );
}
六、可视化设计
6.1 日历热力图
6.2 类别热力图
6.3 饼图分析
6.4 趋势图表
七、交互设计
7.1 添加记录流程
7.2 热力图交互
7.3 筛选记录流程
八、扩展功能规划
8.1 后续版本规划
8.2 功能扩展建议
8.2.1 预算管理
预算功能:
- 设置月度总预算
- 设置各类别预算
- 预算进度条显示
- 超支预警提醒
8.2.2 数据导出
导出功能:
- 导出Excel报表
- 导出PDF报告
- 分享消费统计图
- 数据备份恢复
8.2.3 智能分析
智能功能:
- AI消费建议
- 异常消费检测
- 消费预测分析
- 同比环比分析
九、注意事项
9.1 开发注意事项
-
金额精度:使用double类型,注意精度问题
-
日期过滤:比较日期时注意年月日匹配
-
动画释放:AnimationController需要在dispose时释放
-
空数据处理:统计数据为空时需要特殊处理
-
颜色强度:热力图强度计算需要归一化
9.2 常见问题
| 问题 | 原因 | 解决方案 |
|---|---|---|
| 热力图颜色不对 | 强度计算错误 | 检查maxValue是否正确 |
| 饼图不显示 | 总额为0 | 添加总额判断 |
| 趋势图变形 | 数据点过少 | 添加空数据处理 |
| 日期筛选失效 | 日期格式不一致 | 使用DateTime比较 |
9.3 设计理念
💰 设计理念 💰
每一笔消费都是生活的痕迹,
每一次支出都有它的意义。
通过热力图的可视化呈现,
让抽象的数字变成直观的色彩,
帮助用户发现消费规律,
优化支出结构,
实现财务自由的第一步。
十、运行说明
10.1 环境要求
| 环境 | 版本要求 |
|---|---|
| Flutter SDK | >= 3.0.0 |
| Dart SDK | >= 2.17.0 |
| 鸆蒙OS | API 21+ |
10.2 运行命令
# 查看可用设备
flutter devices

# 运行到Web服务器
flutter run -d web-server -t lib/main_spending_heatmap.dart --web-port 8112

# 运行到鸿蒙设备
flutter run -d 127.0.0.1:5555 lib/main_spending_heatmap.dart

# 运行到Edge浏览器
flutter run -d edge lib/main_spending_heatmap.dart

# 代码分析
flutter analyze lib/main_spending_heatmap.dart
十一、总结
消费热力图应用通过概览统计、热力图展示、消费分析、明细记录四大模块,为用户提供了一个直观了解消费分布的可视化平台。应用支持9种消费分类和多种时间粒度查看,通过日历热力图、类别热力图、饼图、趋势图等多种可视化方式,帮助用户发现消费规律。
核心功能涵盖消费统计、热力图可视化、饼图分析、趋势图表、消费洞察五大模块。统计系统支持按月汇总消费数据,计算各类别占比;热力图系统通过颜色强度直观展示消费分布;分析系统提供饼图和趋势图两种可视化方式;洞察系统基于数据提供个性化理财建议。
应用采用Material Design 3设计规范,以珊瑚红为主色调,营造温馨而不失警示感的视觉体验。通过本应用,希望能够帮助用户了解自己的消费习惯,发现消费规律,优化支出结构,实现财务健康。
可视化你的钱都花在哪了

作为“人工智能6S店”的官方数字引擎,为AI开发者与企业提供一个覆盖软硬件全栈、一站式门户。
更多推荐
 0
0 0
0- 0


 已为社区贡献2条内容

所有评论(0)