
【vLLM-性能调优】vLLM场景下Profiling使用指导与能力汇总
摘要: vLLM-Ascend是针对昇腾NPU优化的高性能推理框架,集成Ascend PyTorch Profiler性能分析工具,支持全栈性能数据采集。通过环境变量或API控制Profiling开关,开发者可采集PyTorch算子、CANN软件栈及NPU硬件层的执行数据,支持离线推理、在线服务及性能基准测试场景。框架提供灵活的配置参数,包括采集级别(Level0-Level2)、AI Core指
作者:昇腾实战派
0. 背景概述
vLLM-Ascend是针对昇腾NPU优化的高性能推理框架,集成Ascend PyTorch Profiler性能分析工具,支持全栈性能数据采集。通过Profiling能力,开发者可深入分析PyTorch层算子、CANN软件栈及NPU硬件层的执行效率,精准定位性能瓶颈,实现模型推理的深度优化
1. 使用指导
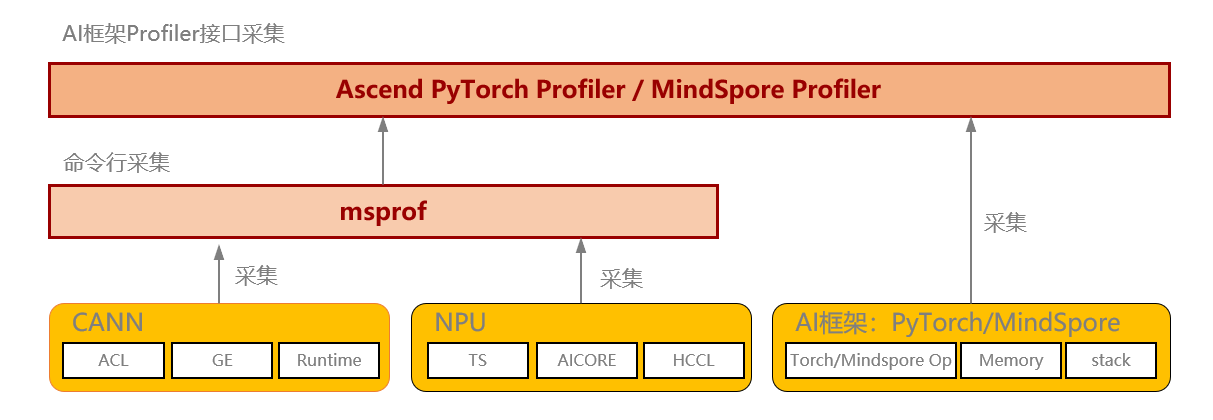
vLLM-Ascend推理框架通过集成 torch_npu.profiler接口实现性能数据采集,使用参数与Ascend PyTorch Profiler的参数完全一致。
Ascend PyTorch Profiler 完全对标 PyTorch-GPU场景下的使用方式,支持采集PyTorch层算子信息、CANN层算子信息、底层NPU算子信息、以及算子内存占用信息等,可以全方位分析PyTorch AI任务的性能状态。详细资料
1.1 Profiling数据采集
通过环境变量VLLM_TORCH_PROFILER_DIR来决定是否启用Profiling采集能力。
export VLLM_TORCH_PROFILER_DIR="./vllm_profile"
脚本使能方式
对于离线推理,参照vLLM中的simple_profiling.py样例,通过start_profile(), stop_profile()启用 profiling:
import os
import time
from vllm import LLM, SamplingParams

# enable torch profiler, can also be set on cmd line
os.environ["VLLM_TORCH_PROFILER_DIR"] = "./vllm_profile"

prompts = [
    "Hello, my name is",
    "The president of the United States is",
    "The capital of France is",
    "The future of AI is",
]

# Create a sampling params object.
sampling_params = SamplingParams(temperature=0.8, top_p=0.95)
# Create an LLM.
llm = LLM(model="Qwen2.5-0.5B-Instruct")
# 开启性能采集
llm.start_profile()
# Generate texts from the prompts.
outputs = llm.generate(prompts, sampling_params)
# 结束性能采集
llm.stop_profile()

for output in outputs:
    prompt = output.prompt
    generated_text = output.outputs[0].text
    print(f"Prompt: {prompt!r}, Generated text: {generated_text!r}")

time.sleep(10)
vLLM-benchmark方式
Step1:拉起在线服务
VLLM_PROMPT_SEQ_BUCKET_MAX=128 VLLM_PROMPT_SEQ_BUCKET_MIN=128
python3 -m vllm.entrypoints.openai.api_server --port 8080
--model "facebook/opt-125m" --tensor-parallel-size 1
--max-num-seqs 128 --dtype bfloat16
--max-model-len 256
Step2:通过benchmark向服务发送固定长度请求,并采集profiling
python benchmarks/benchmark_serving.py \
     --backend vllm \
     --model "facebook/opt-125m" \
     --port 8080 \
     --dataset-name "random" --random-input-len 128 --random-output-len 4 \
     --random-range-ratio 1.0 \
     --ignore-eos \
     --profile \
     --max-concurrency "4" \
     --request-rate "inf" \
     --num-prompts 4 \
     --percentile-metrics "ttft,tpot,itl,e2el"
Step3:解析profiling
from torch_npu.profiler.profiler import analyse

if __name__ == "__main__":
    analyse(profiler_path="path/to/profiling")
curl命令触发方式:
Step1:拉起在线服务
VLLM_PROMPT_SEQ_BUCKET_MAX=128 VLLM_PROMPT_SEQ_BUCKET_MIN=128
python3 -m vllm.entrypoints.openai.api_server --port 8080
--model "facebook/opt-125m" --tensor-parallel-size 1
--max-num-seqs 128 --dtype bfloat16
--max-model-len 256
Step2:服务拉起后,发送开始性能采集请求
curl -X POST http://localhost:8080/start_profile
Step3:发送Requests
curl http://localhost:8080/v1/completions \
  -H "Content-Type: application/json" \
  -d '{
    "model": "facebook/opt-125m",
    "prompt": "San Francisco is a",
    "max_tokens": 7,
    "temperature": 0
}'
Step4:发送停止性能采集请求
curl -X POST http://localhost:8080/stop_profile
1.2 修改profiling配置参数
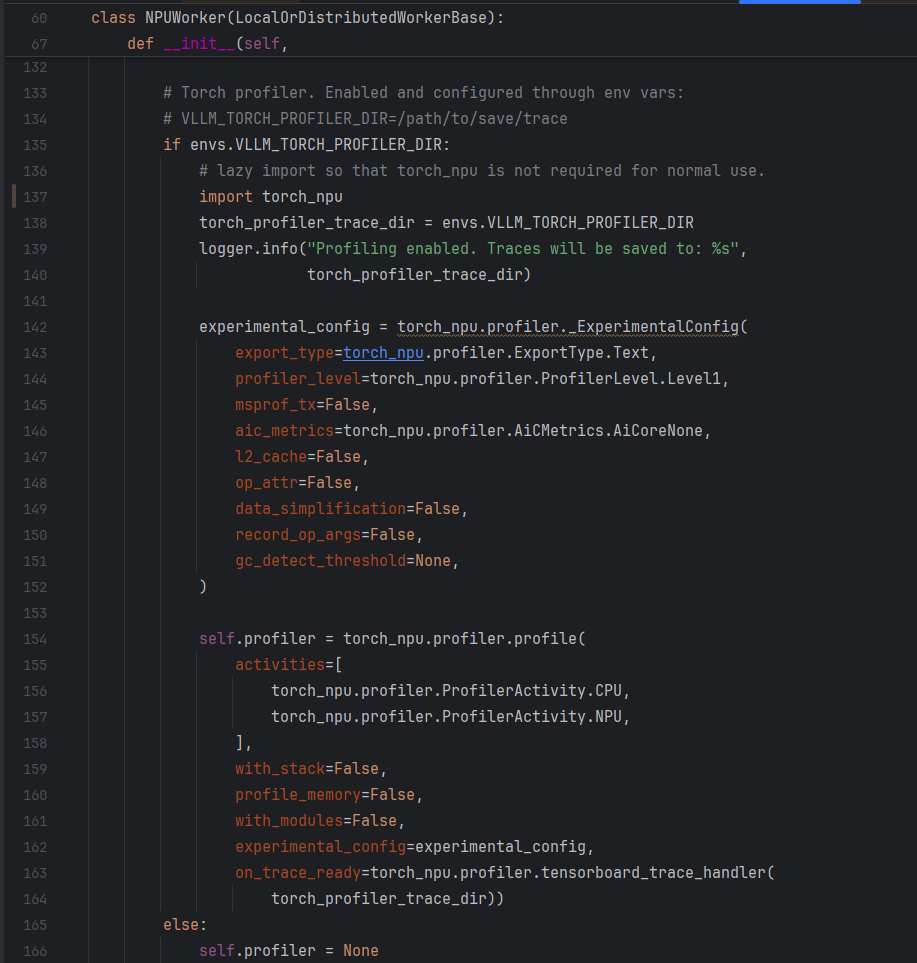
vLLM-Ascend在初始化NPUWorker时创建profiler对象,具体代码在vllm-ascend/vllm-ascend/worker.py(单算子下发)或worker_v1.py(开启图模式),如下图所示。如果默认配置不满足要求,比如level、activity等,可以手动修改profiling配置参数。
Ascend PyTorch Profiler 性能采集配置参数说明
- 基础参数配置
torch_npu.profiler.profile的参数体系完全对标原生PyTorch Profiler,主要包含以下核心功能配置:activities: CPU、NPU事件采集列表。record_shapes: 算子的InputShapes和InputTypes,Bool类型。profile_memory: 算子的内存占用情况,Bool类型,默认为Falsewith_stack: 算子调用栈,Bool类型,默认为False。schedule: 设置不同step的行为,Callable类型,通常使用torch_npu.profiler.schedule函数作为参数,通过与profiler.step()接口共同起作用。on_trace_ready: 设置采集结束时执行的操作,Callable类型。通常选择tensorboard_trace_handler,该接口用于解析采集的Profiling数据。
- NPU专属扩展配置
通过experimental_config参数提供昇腾NPU特有的性能采集项,主要包含以下核心功能配置:
export_type:导出的性能数据结果文件格式,List类型,例如[“db”, “text”]msprof_tx:打点控制开关,通过开关开启自定义打点功能,bool类型mstx_domain_include:输出需要的domain数据。调用torch_npu.npu.mstx系列打点接口,可选择只输出本参数配置的domain数据mstx_domain_exclude:过滤不需要的domain数据profiler_level:设置NPU采集的Level,支持以下配置:
| ProfilerLevel | Profiling数据 |
|---|---|
| Level0 | 框架侧及Device侧算子执行耗时,为默认值。 |
| Level1 | Level0基础上增加CANN软件栈中AscendCL接口、HCCL通信及AI Core的性能指标数据 |
| Level2 | Level1基础上增加CANN软件栈的Runtime数据及AI CPU数据 |
aic_metrics:AI Core的性能指标采集项,Level0时该配置不生效。参数具体配置项如下:
| AicMetrics | Metrics数据 |
|---|---|
| AiCoreNone | 关闭AI Core的性能指标采集,默认值。 |
| PipeUtilization | 计算单元和搬运单元耗时占比 |
| ArithmeticUtilization | 各种计算类指标占比统计 |
| Memory | 外部内存读写类指令占比 |
| MemoryL0 | L0内存读写类指令占比 |
| ResourceConflictRatio | 流水线队列类指令占比 |
| MemoryUB | 内部内存 |
| L2Cache | 读写cache命中次数和缺失后重新分配次数 |
l2_cache:l2 cache数据采集开关
1.3 Profiling采集结果
交付件介绍
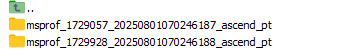
Profiling结果将输出至VLLM_TORCH_PROFILER_DIR 指定的目录下,每张NPU对应生成一个以ascend_pt结尾的文件夹,如下图所示:
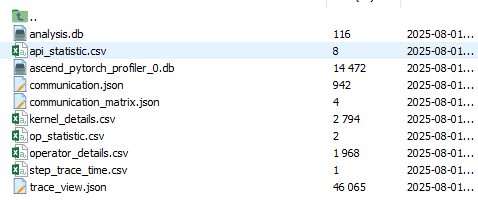
其中各个文件夹下结构为: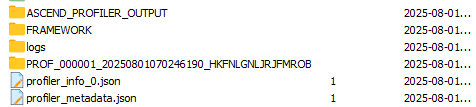
其中ASCEND_PROFILER_OUTPUT文件夹内存放了解析后的性能数据,可以分为两大类型:
- Timeline文件 (
trace_view.json):- 使用MindStudio Insight打开,可视化展示AI任务运行时各层级算子的调用关系与执行时序。
- Summary文件:
- 多维度的统计摘要信息
- 典型文件:
kernel_details.csv(kernel详细信息)、communication.json(通信算子信息)等
数据可视化:
使用MindStudio Insight打开timeline文件,显示框架侧调用栈(采集时将with_module参数设为True)
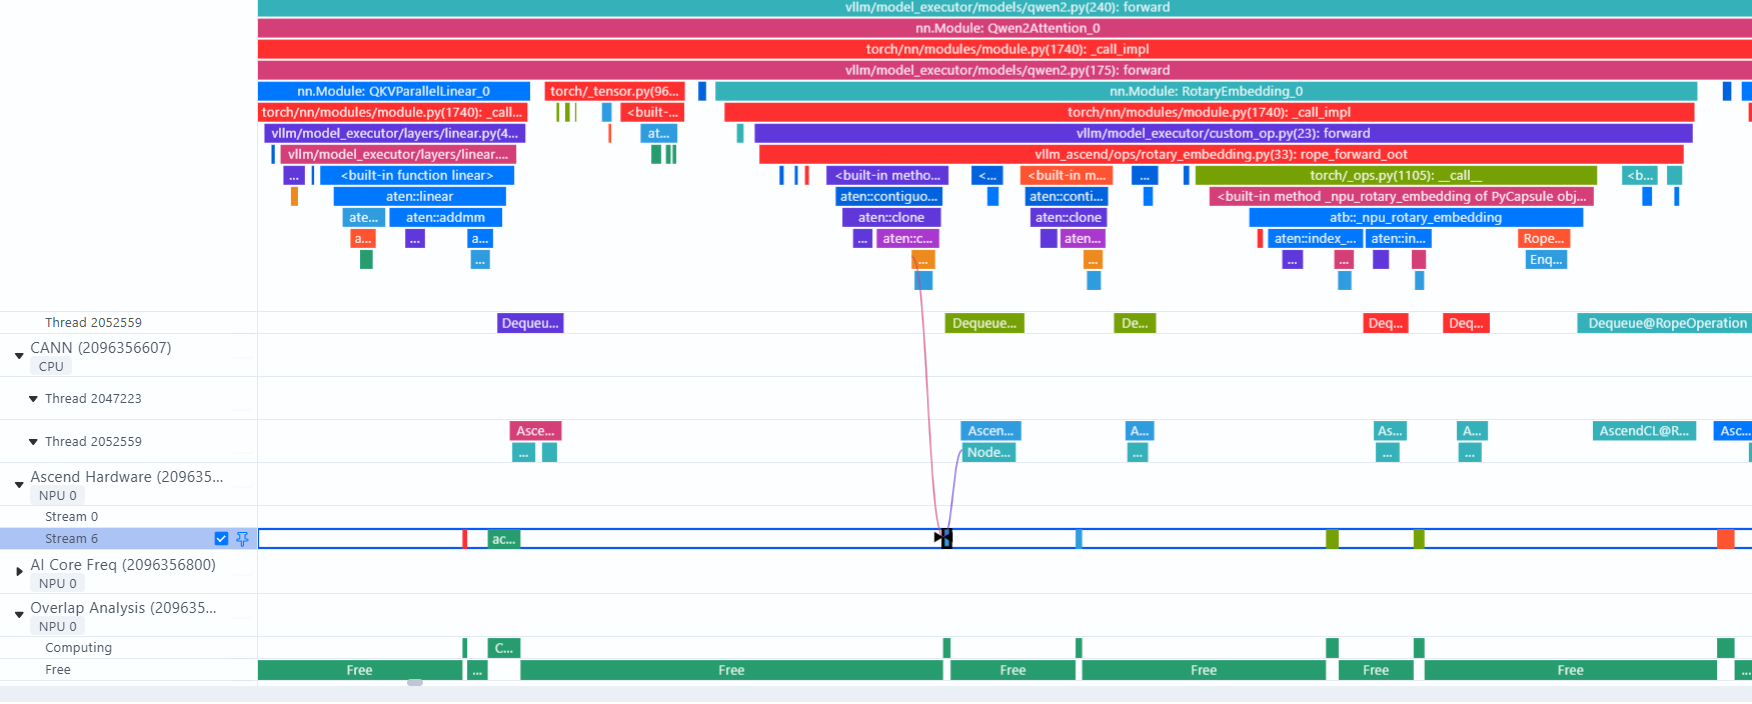
从Python调用栈可以详细分析代码执行顺序、调用过程。
Ascend Hardware显示算子执行层,点击对应算子可显示算子执行时间,和下发连线。
通过Overlap Analysis分析通信、计算、空闲的比例,可用于定位算子执行过程中是否存在空泡。
MSTX 性能自定义打点
mstx接口是MindStudio提供的一个性能打点接口,它允许用户在应用程序中插入特定的标记,以便在性能分析时能够更精确地定位关键代码区域。
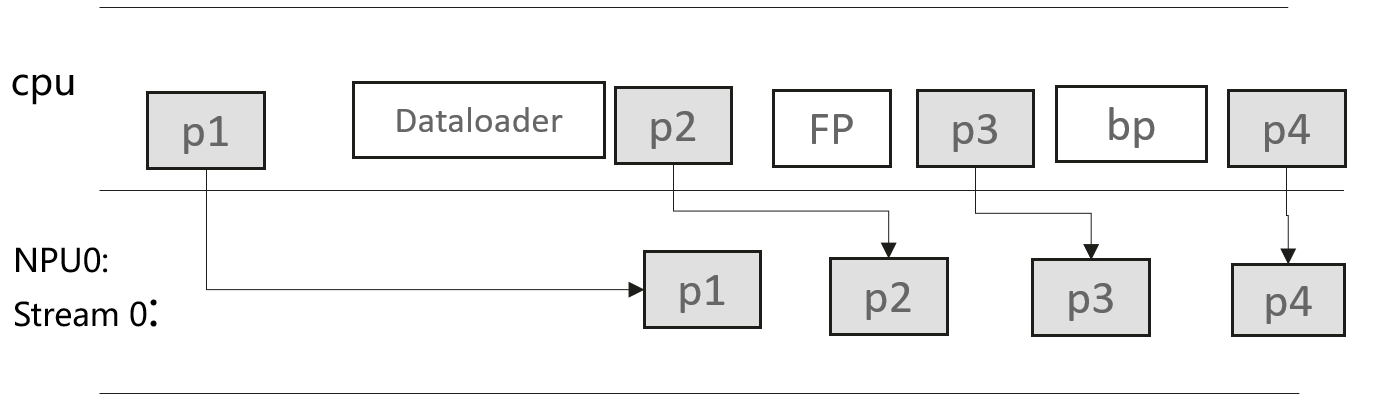
torch_npu 中封装的mstx接口:
- 通过
torch_npu.npu.mstx.mark接口标识瞬时事件,比如标识"训练开始" - 通过range接口(
torch_npu.npu.mstx.range_start/torch_npu.npu.mstx.range_end)标识时间段事件,比如标识"前向"、“反向”、"allreduce"等 - 对于mstx接口,不传stream入参,只记录cpu侧时间信息,适用于纯cpu侧操作;传stream入参,会记录cpu侧时间及对应npu侧的时间信息,比如算子执行情况
- 采集打点性能数据,需在
experimental_config中设置msprof_tx=True,当前已内置通信算子、dataloader耗时、检查点接口耗时的性能数据采集
样例1: mark打点迭代开始时间
class TrainModel:
    def __init__(self):
        self.input_shape = (4, 3, 24, 24)
        self.out_shape = (4, 12, 24, 24)
        self.device = torch.device("npu:0")
        self.model = SmallModel(self.input_shape[1], self.out_shape[1]).to(self.device)
        self.criterion = torch.nn.MSELoss()
        self.optimizer = torch.optim.SGD(self.model.parameters(), lr=0.0001)

    def train_one_step(self):
        stream = torch_npu.npu.current_stream()
        torch_npu.npu.mstx.mark("mark for train_one_step begin", stream)
        inputs = torch.rand(self.input_shape).to(self.device)
        target = torch.rand(self.out_shape).reshape(self.out_shape[0], -1).to(self.device)
        output = self.model(inputs)
        loss = self.criterion(output, target)
        self.optimizer.zero_grad()
        loss.backward()
        self.optimizer.step()
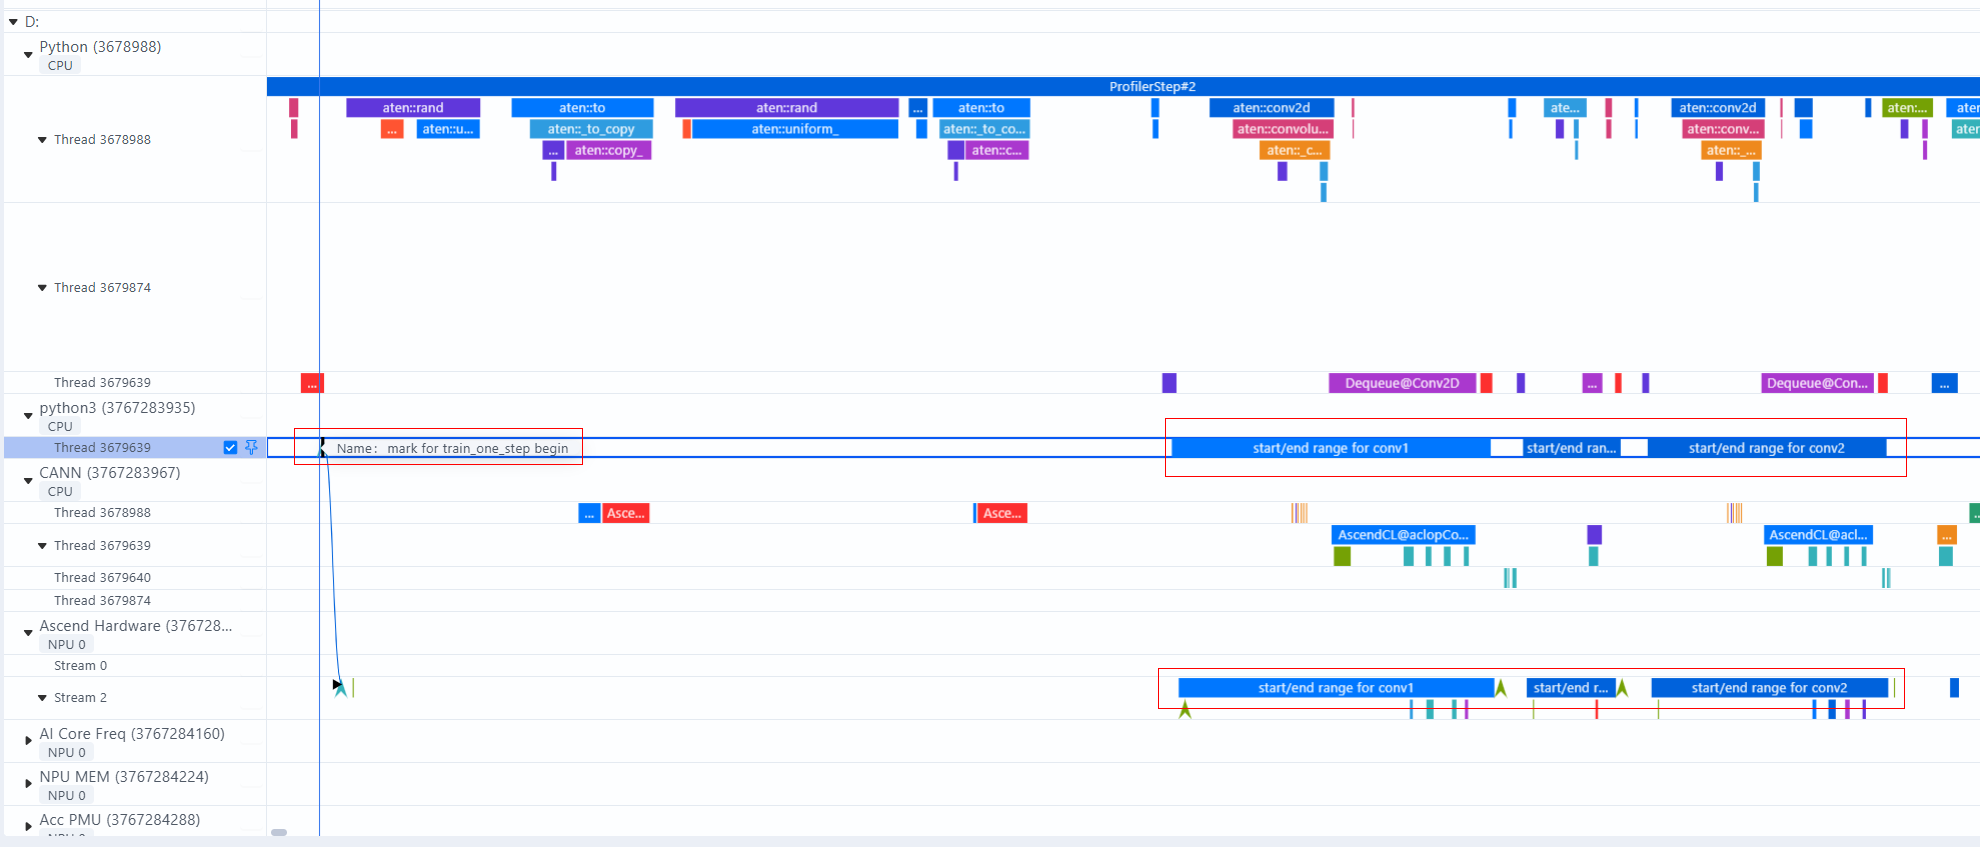
**样例2: **在计算流上打点,记录Host侧range耗时和Device侧对应的range耗时:
class SmallModel(torch.nn.Module):
    def __init__(self, in_channel=3, out_channel=12):
        super(SmallModel, self).__init__()
        self.conv1 = torch.nn.Conv2d(in_channel, in_channel, 3, padding=1)
        self.relu1 = torch.nn.ReLU()
        self.conv2 = torch.nn.Conv2d(in_channel, out_channel, 3, padding=1)

    def forward(self, input_1):
        stream = torch_npu.npu.current_stream()
        mstx_conv1 = torch_npu.npu.mstx.range_start("start/end range for conv1", stream)
        input_1 = self.conv1(input_1)
        torch_npu.npu.mstx.range_end(mstx_conv1)

        mstx_relu1 = torch_npu.npu.mstx.range_start("start/end range for relu", stream)
        input_1 = self.relu1(input_1)
        torch_npu.npu.mstx.range_end(mstx_relu1)

        mstx_conv2 = torch_npu.npu.mstx.range_start("start/end range for conv2", stream)
        input_1 = self.conv2(input_1)
        torch_npu.npu.mstx.range_end(mstx_conv2)

        return input_1.reshape(input_1.shape[0], -1)
模型结构拆解与算子关联分析能力
msprof-analyze提供了针对PyTorch模型自动解析模型层级结构的分析能力(module_analysis),帮助精准定位性能瓶颈,为模型优化提供关键洞察。该分析能力提供:
- 自动提取并展示模型的层次化结构,以及模型中的算子调用顺序
- 建立框架层算子下与NPU上执行Kernel的映射关系
- 统计并输出Device侧Kernel的执行耗时
拆解结果: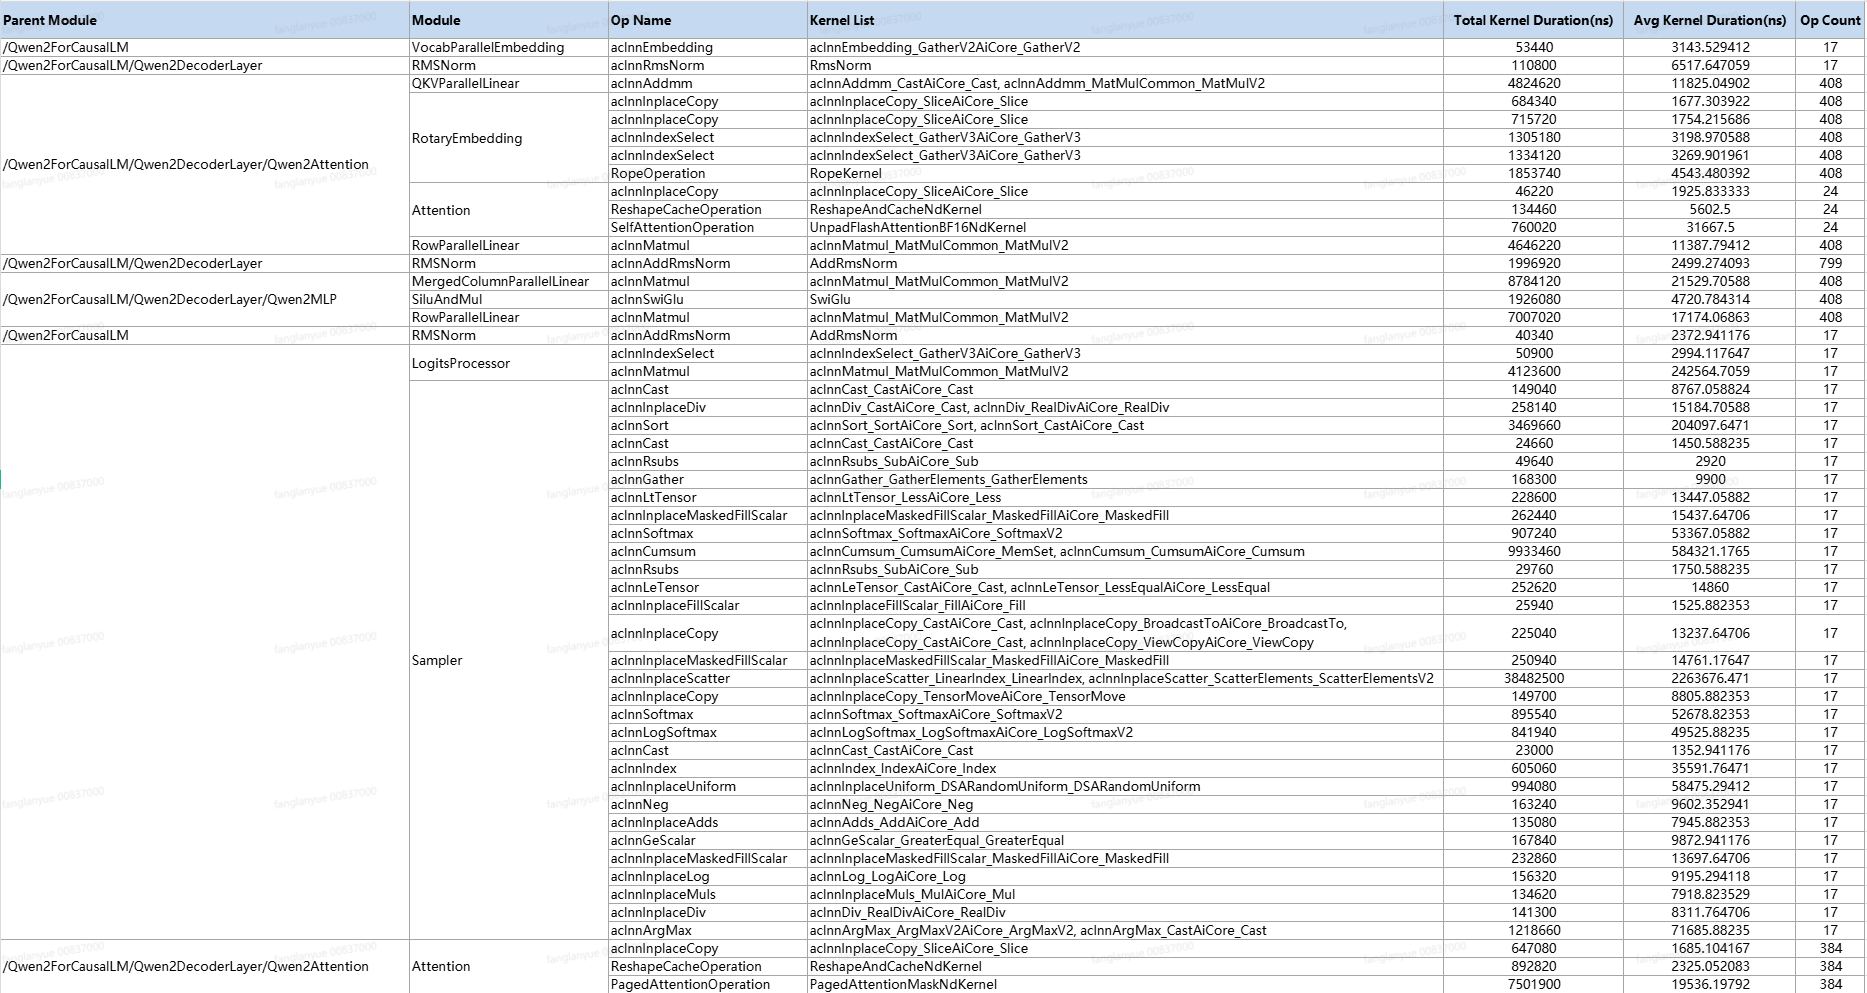
使用方式:
-
修改
vllm_ascend/worker/worker.py中的 profile 配置,如下图所示:- 修改
experimental_config中的msprof_tx为True,开启自定义打点功能 - 数据导出类型
export_type添加db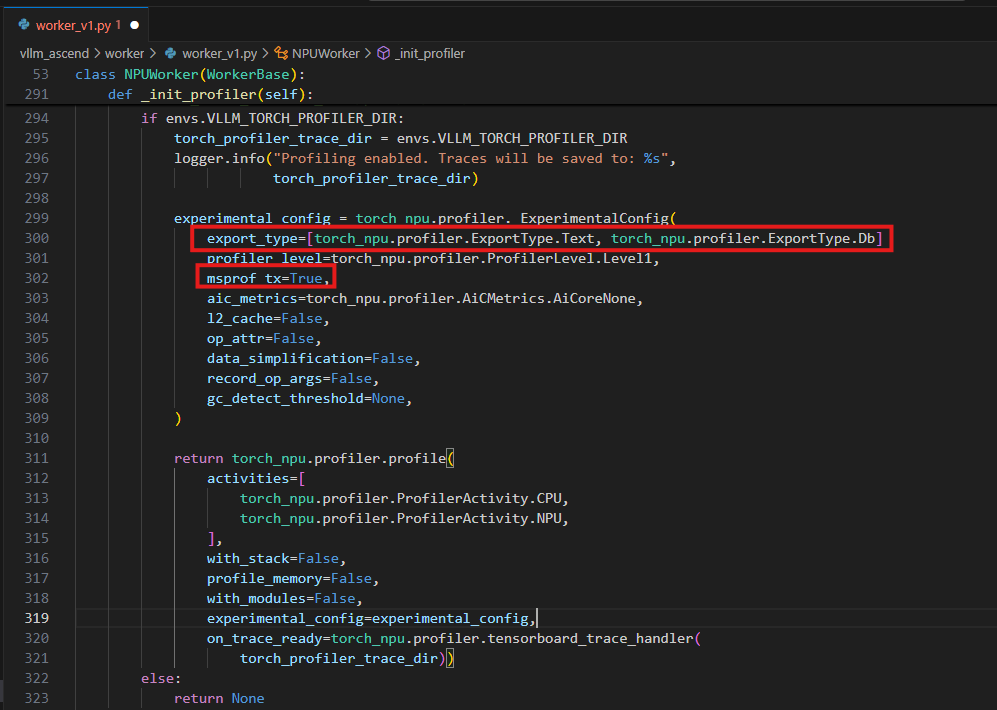
- 修改
-
在脚本中添加模型层级打点
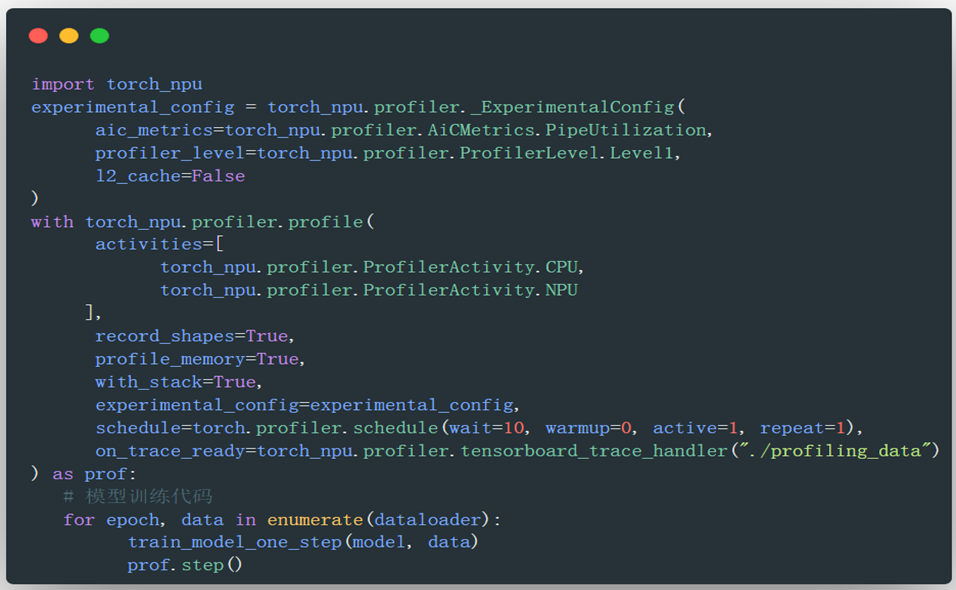
通过修改PyTorch的nn.Module.__call__方法,在模型前向传播时插入mstx range打点,实现自动化的性能标记,完整样例如下:import os import time import torch import torch_npu import torch.nn as nn from vllm import LLM, SamplingParams original_call = nn.Module.__call__ def custom_call(self, *args, **kwargs): """自定义调用方法,添加MSTX打点""" module_name = self.__class__.__name__ mstx_id = torch_npu.npu.mstx.range_start(module_name, domain="Module") # Module开始时间打点,设置domain为Module tmp = original_call(self, *args, **kwargs) torch_npu.npu.mstx.range_end(mstx_id, domain="Module") # Module结束时间打点,设置domain为Module return tmp # 替换默认调用方法 nn.Module.__call__ = custom_call # 通过VLLM_TORCH_PROFILER_DIR环境变量开启性能采集,设置性能数据落盘位置,也可以在终端设置该环境变量 os.environ["VLLM_TORCH_PROFILER_DIR"] = "./result" prompts = [ "Hello, my name is", "The president of the United States is", "The capital of France is", "The future of AI is", ] # Create a sampling params object. sampling_params = SamplingParams(temperature=0.8, top_p=0.95) # Create an LLM. llm = LLM(model="Qwen/Qwen2.5-0.5B-Instruct") llm.start_profile() # 开启性能采集 outputs = llm.generate(prompts, sampling_params) llm.stop_profile() # 结束性能采集 for output in outputs: prompt = output.prompt generated_text = output.outputs[0].text print(f"Prompt: {prompt!r}, Generated text: {generated_text!r}")mstx打点可视化:
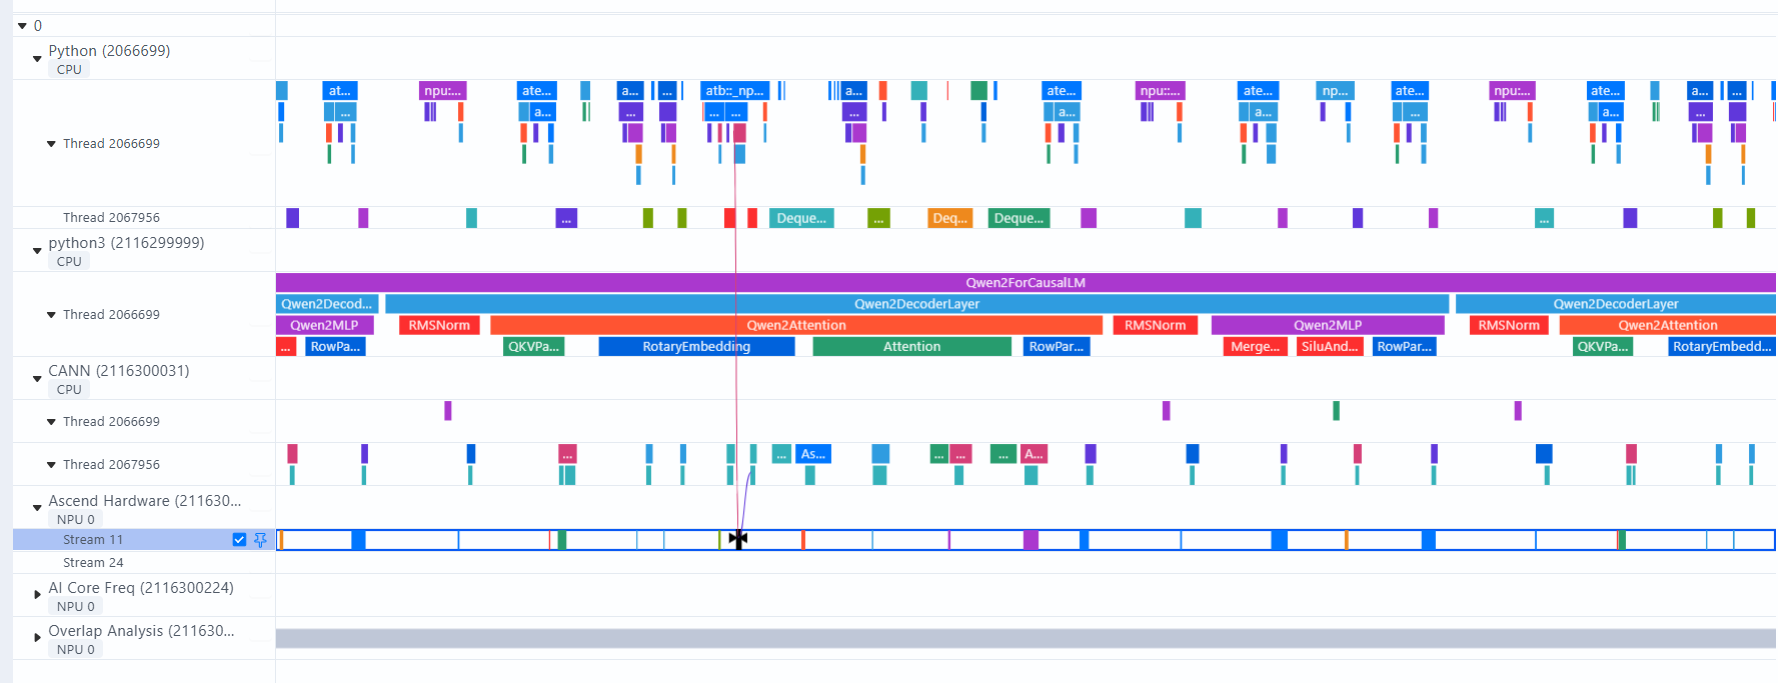
-
执行分析命令
msprof-analyze cluster -m module_statistic -d ./result --export_type excel
演进计划:
- 增加device侧PMU、详细计算耗时等细粒度展示
- 增加device侧通信等待和传输耗时的拆解
- 增加profiling的对比能力
- 增加昇腾与NVIDIA的对比能力
工具链接:mstt (pre-research)
vLLM图模式Profiling采集:
Q:图模式如何采集到下发连线,算子shape信息?Profiling解析时报错Fail to get acl to npu flow events?
A:当前capture阶段在LLM实例初始化环节,而start_profile在初始化之后,所以采集不到capture,无下发连线与算子shape等信息。临时解决方式,手动修改vllm,vllm/v1/engine/core.py,同时无需再次调用llm.start_profile()接口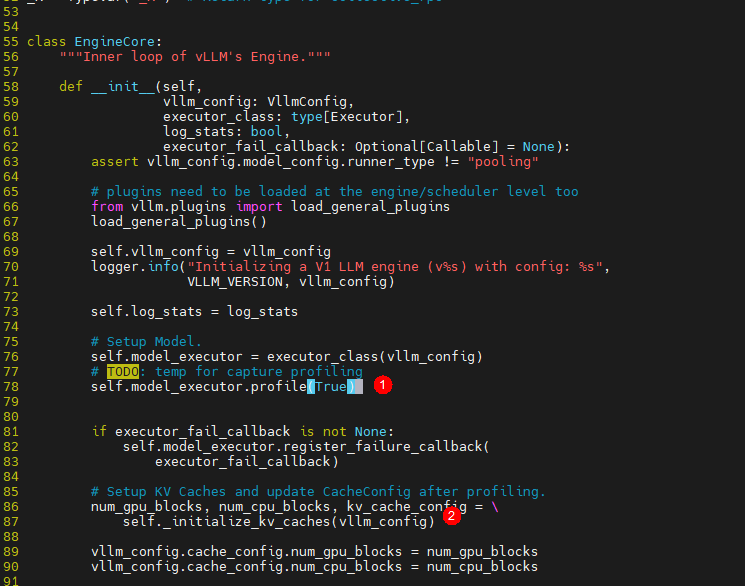
注:① 在EngineCore初始化阶段开启profile采集;② _initialize_kv_caches中执行capture;

作为“人工智能6S店”的官方数字引擎,为AI开发者与企业提供一个覆盖软硬件全栈、一站式门户。
更多推荐
 19
19 0
0- 0


 已为社区贡献1条内容

所有评论(0)