
Triton - Ascend算子调试技巧:从入门到精通
本文系统介绍了Triton在昇腾AI处理器上的算子调试全流程。首先阐述了Triton调试的重要性及其复杂性来源,然后详细解析了调试工具链,包括Triton内置调试算子、AscendDebugger硬件级调试和CPU/NPU孪生调试策略。文章深入讲解了性能分析工具msProf的使用方法,以及如何识别和分类计算瓶颈、内存瓶颈等性能问题。针对常见调试场景,提供了内存对齐、Atomic操作等问题的具体解决
目录
摘要
本文深入解析Triton在昇腾AI处理器上的算子调试全流程,从基础调试工具使用到高级性能优化。通过对Triton调试算子、Ascend Debugger、性能分析工具的实战演示,以及内存对齐、原子操作等典型问题的解决方案,帮助开发者快速定位和修复算子缺陷。文章还涵盖了企业级实践案例和前瞻性调试方法论,为AI开发者提供了一套完整的昇腾算子调试体系。
1 引言:为什么Triton算子调试如此重要?
在AI计算飞速发展的今天,华为昇腾AI处理器已成为深度学习训练和推理的重要算力基石。OpenAI推出的Triton语言以其"Python语法、接近CUDA性能"的特性,显著降低了NPU算子的开发门槛。然而,"能运行"只是第一步,"跑得快、无Bug"才是最终目标。
基于我多年在昇腾算子开发的经验,Triton调试的复杂性主要来源于三个层面:硬件抽象差异、编译链复杂性和运行时环境不确定性。与传统的Ascend C直接操控硬件方式不同,Triton通过多层抽象(MLIR、AscendNPU IR)将Python代码转换为NPU指令,这一过程虽然提升了开发效率,但也增加了调试的难度。
核心挑战在于:如何在不直接操控硬件细节的情况下,精准定位性能瓶颈和逻辑错误?本文将围绕这一核心问题,展开全方位的调试技巧解析。
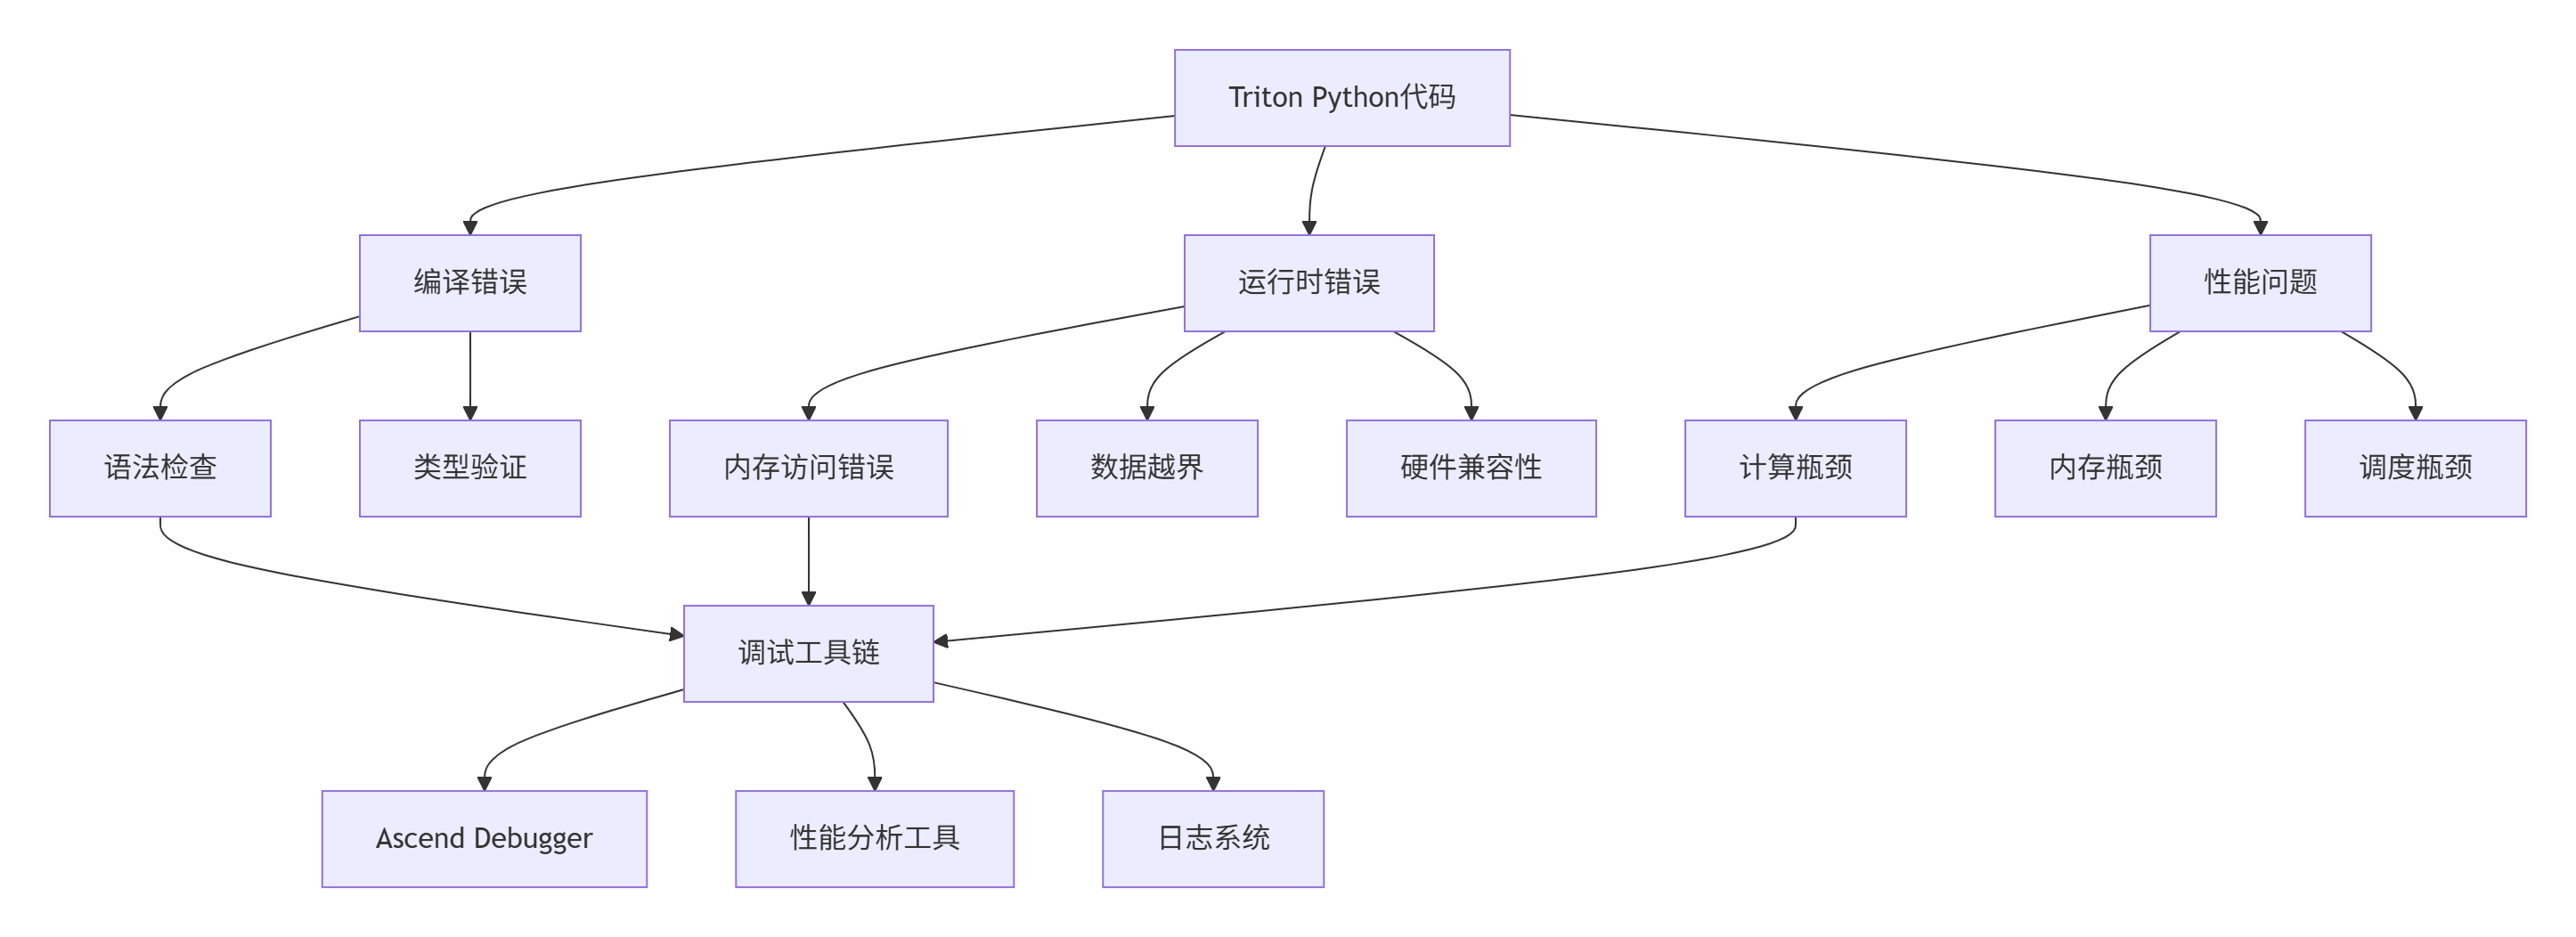
图1:Triton算子调试问题分类与工具映射。不同类型的问题需要针对性的调试工具。
2 Triton调试工具链全景解析
2.1 Triton内置调试算子
Triton提供了一组专门的调试算子,可以在不同阶段输出关键信息,这是最直接有效的调试手段。
import torch
import torch_npu
import triton
import triton.language as tl

@triton.jit
def debug_add_kernel(
    x_ptr, y_ptr, output_ptr, n_elements, BLOCK_SIZE: tl.constexpr
):
    # 编译时打印BLOCK_SIZE值
    tl.static_print(f"BLOCK_SIZE: {BLOCK_SIZE}")

    pid = tl.program_id(axis=0)

    # 设备端运行时打印 - 仅打印特定pid避免信息过载
    if pid == 0:
        tl.device_print("Processing PID: ", pid)

    block_start = pid * BLOCK_SIZE
    offsets = block_start + tl.arange(0, BLOCK_SIZE)
    mask = offsets < n_elements

    # 编译时断言BLOCK_SIZE有效性
    tl.static_assert(BLOCK_SIZE >= 64, "BLOCK_SIZE太小会影响性能")

    x = tl.load(x_ptr + offsets, mask=mask)
    y = tl.load(y_ptr + offsets, mask=mask)

    # 设备端运行时断言
    tl.device_assert(tl.all(x == x), "检测到NaN值")

    output = x + y
    tl.store(output_ptr + offsets, output, mask=mask)

def test_debug_ops():
    """测试调试算子的使用"""
    size = 1024
    x = torch.rand(size, device='npu', dtype=torch.float32).contiguous()
    y = torch.rand(size, device='npu', dtype=torch.float32).contiguous()
    output = torch.empty_like(x)

    grid = lambda meta: (triton.cdiv(size, meta['BLOCK_SIZE']),)

    print("=== 开始调试算子测试 ===")
    debug_add_kernel[grid](x, y, output, size, BLOCK_SIZE=128)
    print("=== 调试算子测试完成 ===")

    return output

if __name__ == "__main__":
    result = test_debug_ops()
代码1:Triton调试算子的完整使用示例。static_print用于编译时输出,device_print用于运行时调试。
实战技巧:在实际项目中,我通常采用分阶段调试策略:
-
编译期调试:使用
tl.static_print和tl.static_assert验证元参数 -
运行时基础调试:在关键路径添加有限的
tl.device_print输出 -
运行时深度调试:使用条件判断限制输出范围,避免数据过载
2.2 Ascend Debugger硬件级调试
对于复杂的硬件相关问题,Ascend Debugger提供了硬件级的断点调试能力,可以查看寄存器状态、内存数据等。
# 编译带调试信息的算子
ascend-gcc -g add_kernel.cu add_host.c -o add_debug -lascend_c_runtime

# 启动Ascend Debugger
ascend-debugger ./add_debug

# 在debugger中设置断点和检查状态
(ascend-debugger) break add_kernel
(ascend-debugger) run
(ascend-debugger) print idx
(ascend-debugger) x/10f a
代码2:Ascend Debugger基础使用命令。这是定位硬件级问题的关键工具。
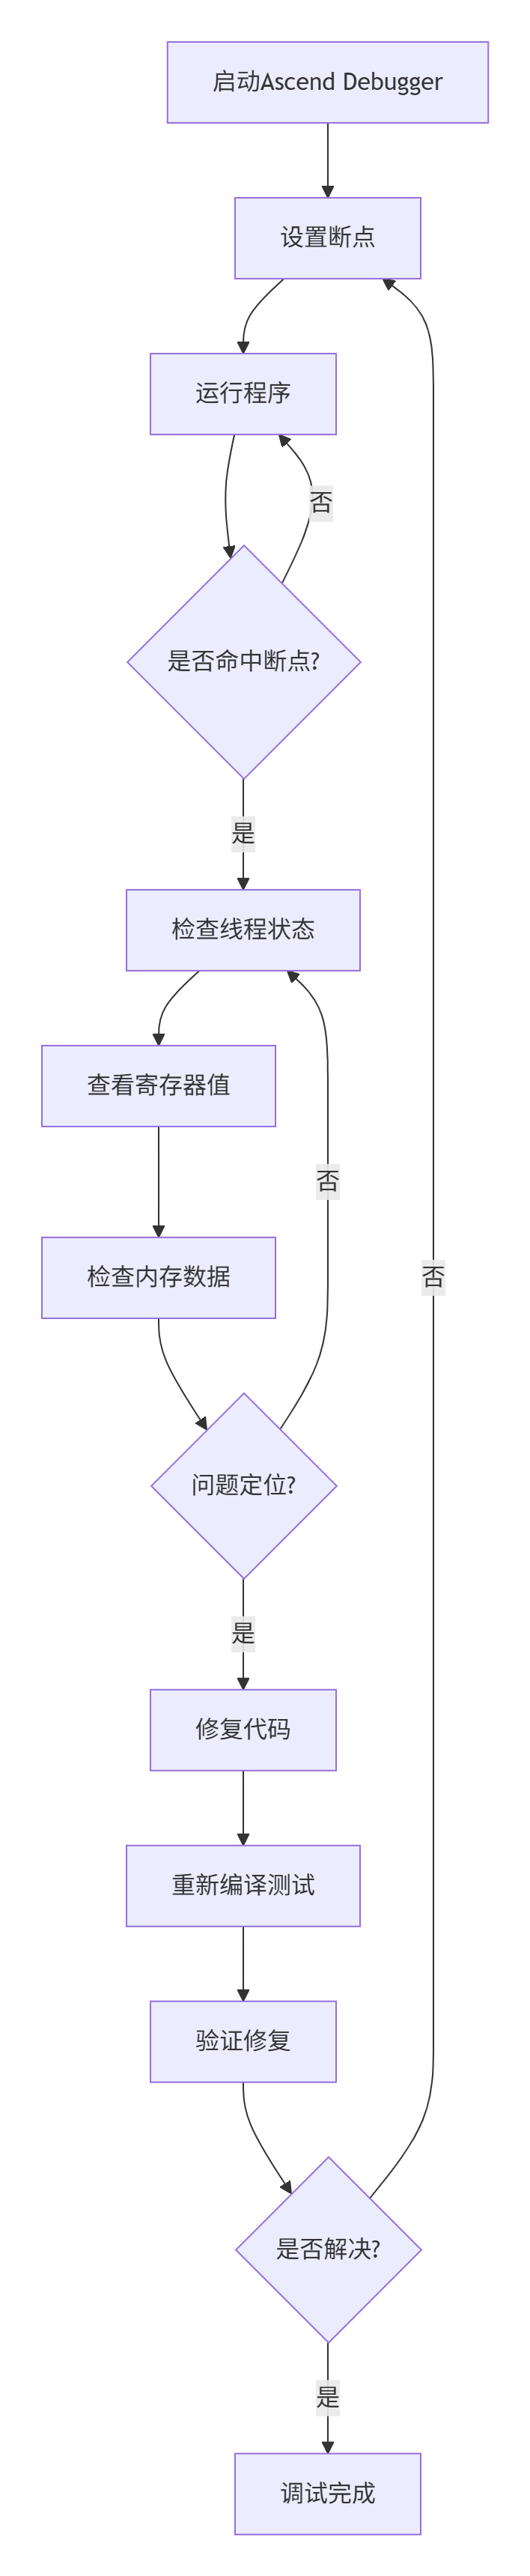
图2:Ascend Debugger调试流程。硬件级调试需要系统性的断点设置和状态检查。
2.3 CPU/NPU孪生调试策略
孪生调试是昇腾平台特有的调试技术,同一份代码可以在CPU上模拟运行,也可以在NPU上真实运行,通过对比结果快速定位问题。
// CPU/NPU孪生调试示例
#define CPU_SIMULATION 1  // 切换开关

#if CPU_SIMULATION
#include "ascend_c_cpu_sim_api.h"  // CPU模拟头文件
#else
#include "ascend_c_runtime_api.h"  // NPU运行时头文件
#endif

int main() {
#if CPU_SIMULATION
    ascendCpuSimInit();  // 初始化CPU模拟环境
    printf("运行在CPU模拟模式\n");
#else
    printf("运行在NPU硬件模式\n");
#endif

    // 统一的算子调用逻辑
    float* h_a, *h_b, *h_c;
    int len = 1024;

    // 分配和初始化数据
    // ... 数据准备代码

    // 调用算子
    add_host(h_a, h_b, h_c, len);

#if CPU_SIMULATION
    ascendCpuSimDestroy();  // 清理CPU模拟环境
#endif

    return 0;
}
代码3:CPU/NPU孪生调试实现。通过编译开关切换运行环境。
个人实践心得:在复杂算子开发中,我通常采用"先在CPU模拟环境调试逻辑,后在NPU环境验证性能"的策略。这种方法能够将逻辑错误与硬件适配问题分离,大幅提升调试效率。特别是对于内存访问模式复杂的算子,CPU环境的确定性调试能力至关重要。
3 性能分析工具深度掌握
3.1 msProf工具全解析
msProf是昇腾平台专业的性能分析工具,可以采集和分析算子运行的关键性能指标。
# 基础性能数据采集
msprof op --application ./my_operator --output ./profiler_result --duration 10

# 指定采集特定算子
msprof op --kernel-name="add|matmul" --application ./my_operator

# 详细性能指标采集
msprof op --aic-metrics=ArithmeticUtilization,Memory,L2Cache --application ./my_operator

# 生成HTML报告
ascend-profiler --report ./profiler_result --format html
代码4:msProf工具常用命令集。不同的参数组合满足不同层次的性能分析需求。
关键指标解读:
-
AI Core利用率:低于60%通常表示计算资源未充分利用
-
内存带宽利用率:接近100%表明存在内存瓶颈
-
L2缓存命中率:低命中率需要优化数据局部性
-
流水线利用率:衡量指令级并行效率
3.2 性能瓶颈识别与分类
根据性能数据特征,可以将性能瓶颈分为三大类,每类有独特的识别模式和优化策略。
# 性能瓶颈分析工具类
class PerformanceAnalyzer:
    def __init__(self, profiler_data):
        self.data = profiler_data
        self.bottleneck_type = None

    def analyze_bottleneck(self):
        """综合分析性能瓶颈类型"""
        metrics = self.extract_metrics()

        if metrics['memory_utilization'] > 0.85 and metrics['compute_utilization'] < 0.6:
            self.bottleneck_type = "内存瓶颈"
            return self.analyze_memory_bottleneck()

        elif metrics['compute_utilization'] < 0.5 and metrics['memory_utilization'] < 0.6:
            self.bottleneck_type = "计算瓶颈"
            return self.analyze_compute_bottleneck()

        elif metrics['scheduling_overhead'] > metrics['computation_time'] * 0.3:
            self.bottleneck_type = "调度瓶颈"
            return self.analyze_scheduling_bottleneck()

        else:
            self.bottleneck_type = "混合瓶颈"
            return self.analyze_mixed_bottleneck()

    def extract_metrics(self):
        """从性能数据提取关键指标"""
        return {
            'memory_utilization': self.data.get('memory_bandwidth_ratio', 0),
            'compute_utilization': self.data.get('ai_core_utilization', 0),
            'scheduling_overhead': self.data.get('scheduling_latency', 0),
            'computation_time': self.data.get('computation_duration', 0)
        }

    def generate_optimization_suggestions(self):
        """基于瓶颈类型生成优化建议"""
        suggestions = {
            "内存瓶颈": [
                "优化数据局部性,增加数据复用",
                "调整Block大小减少全局内存访问",
                "使用共享内存缓存频繁访问的数据"
            ],
            "计算瓶颈": [
                "增加计算强度,减少内存操作比例",
                "使用向量化指令提升并行度",
                "优化循环展开策略"
            ],
            "调度瓶颈": [
                "调整线程块大小,减少调度开销",
                "优化网格布局,提高负载均衡",
                "减少核函数启动次数"
            ]
        }

        return suggestions.get(self.bottleneck_type, ["需要进一步分析具体瓶颈"])
代码5:性能瓶颈自动分析工具。帮助快速识别和分类性能问题。
3.3 高级性能可视化
msProf配合MindStudio可以生成多种可视化图表,直观展示性能特征。
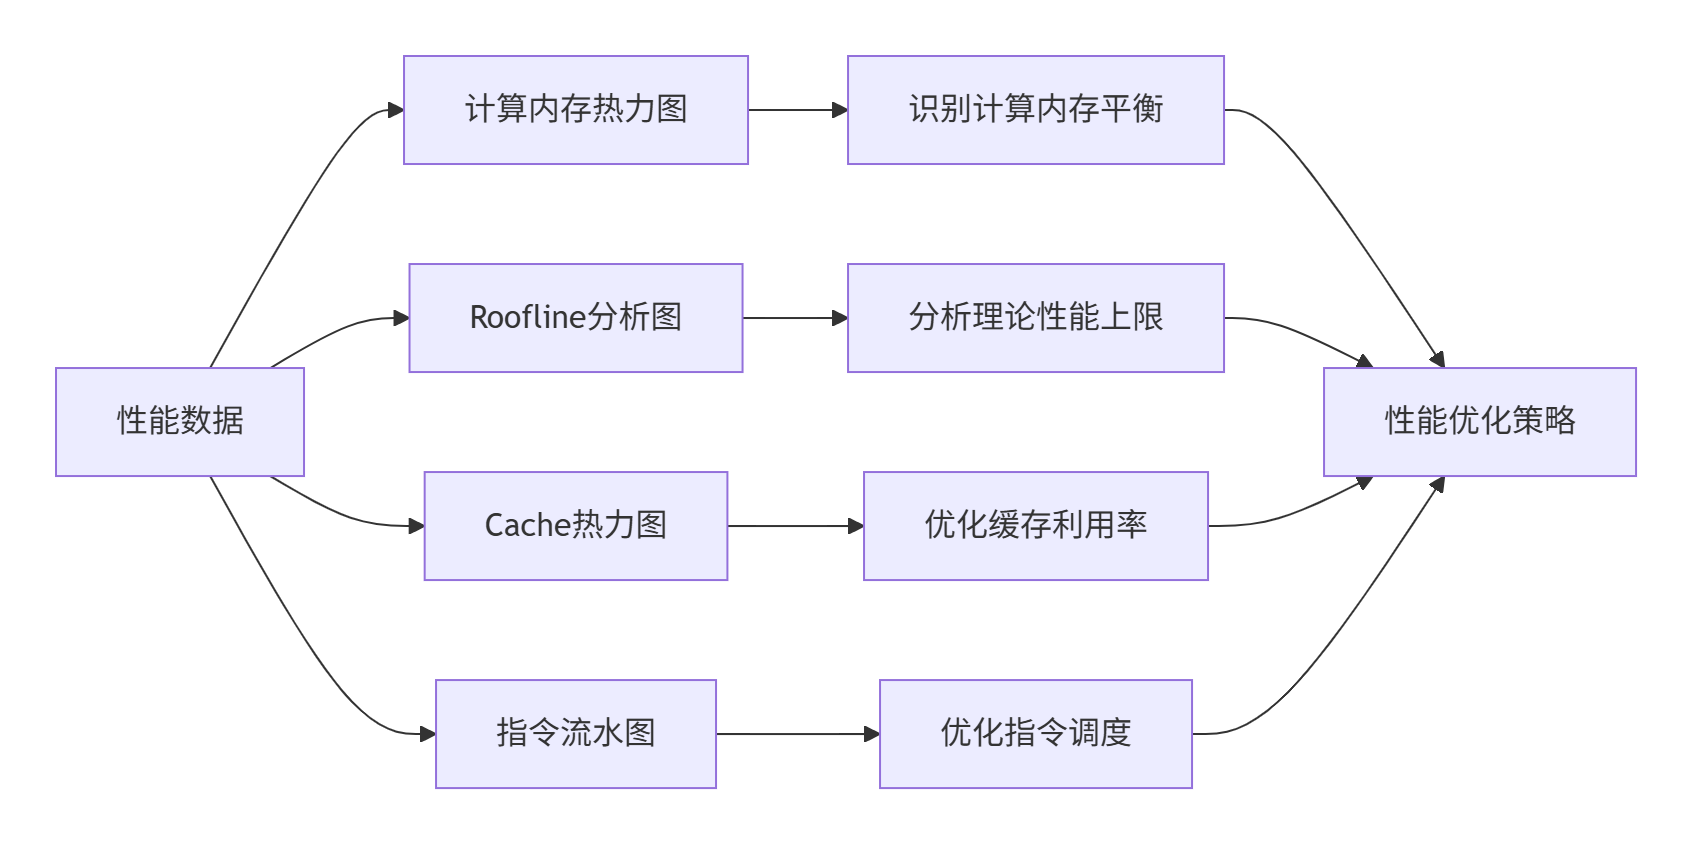
图3:性能可视化工具链。不同的图表从不同维度揭示性能特征。
Roofline模型分析是性能优化的核心工具,它帮助回答关键问题:当前算子是计算瓶颈还是内存瓶颈?离硬件理论性能上限还有多远?在我的实践中,通过Roofline分析可以避免盲目优化,将精力集中在真正的瓶颈上。
4 常见调试场景与解决方案
4.1 内存对齐与连续性问题的调试
内存对齐是昇腾平台上最常见的问题之一,不正确的内存访问会导致性能下降甚至运行时错误。
@triton.jit
def aligned_memory_kernel(
    x_ptr, y_ptr, output_ptr, n_elements, BLOCK_SIZE: tl.constexpr
):
    pid = tl.program_id(axis=0)
    block_start = pid * BLOCK_SIZE
    offsets = block_start + tl.arange(0, BLOCK_SIZE)
    mask = offsets < n_elements

    # 调试技巧1:检查内存地址对齐
    # 在真实场景中,可能需要手动确保对齐
    if pid == 0:
        tl.device_print("第一个Block的偏移量: ", offsets[0])

    # 强制对齐访问 - 实际工程中的技巧
    # 方法:调整偏移量确保对齐边界
    aligned_offsets = (offsets // 16) * 16  # 16字节对齐
    aligned_mask = aligned_offsets < n_elements

    # 使用方法1:直接使用对齐后的偏移量
    x_aligned = tl.load(x_ptr + aligned_offsets, mask=aligned_mask, other=0.0)
    y_aligned = tl.load(y_ptr + aligned_offsets, mask=aligned_mask, other=0.0)

    # 或者方法2:使用非对齐加载但接受性能损失
    x_unaligned = tl.load(x_ptr + offsets, mask=mask, other=0.0)
    y_unaligned = tl.load(y_ptr + offsets, mask=mask, other=0.0)

    # 对比两种方式的性能差异
    output_aligned = x_aligned + y_aligned
    output_unaligned = x_unaligned + y_unaligned

    # 存储结果 - 根据调试结果选择最佳方案
    tl.store(output_ptr + offsets, output_unaligned, mask=mask)

def debug_memory_alignment():
    """调试内存对齐问题"""
    size = 1000  # 特意设置非对齐大小
    x = torch.rand(size, device='npu', dtype=torch.float32)

    # 检查张量是否连续和对齐
    print(f"张量是否连续: {x.is_contiguous()}")
    print(f"数据指针: {x.data_ptr()}")
    print(f"指针对齐检查: {x.data_ptr() % 16 == 0}")

    # 强制对齐分配
    def allocate_aligned_tensor(size, alignment=16):
        # 实际项目中可能需要自定义分配器确保对齐
        original = torch.rand(size, device='npu', dtype=torch.float32)
        if original.data_ptr() % alignment == 0:
            return original
        else:
            # 创建新张量并复制数据,期望获得对齐内存
            aligned = torch.empty_like(original)
            aligned.copy_(original)
            return aligned

    x_aligned = allocate_aligned_tensor(size)
    print(f"对齐后指针: {x_aligned.data_ptr()}")
    print(f"对齐后检查: {x_aligned.data_ptr() % 16 == 0}")

    return x_aligned
代码6:内存对齐调试技巧。包括地址检查、强制对齐等方法。
实战经验:在处理内存对齐问题时,我总结出"检测-修复-验证"的三步法:
-
检测阶段:使用
tl.device_print输出关键地址信息,验证对齐状态 -
修复阶段:通过调整偏移量或使用自定义内存分配器确保对齐
-
验证阶段:对比修复前后的性能数据,确认优化效果
4.2 Atomic操作问题的调试与解决
Atomic操作在昇腾平台上的支持与GPU存在差异,不正确的使用会导致结果错误或性能问题。
@triton.jit
def debug_atomic_operations(
    input_ptr, output_ptr, n_elements, BLOCK_SIZE: tl.constexpr
):
    pid = tl.program_id(axis=0)
    block_start = pid * BLOCK_SIZE
    offsets = block_start + tl.arange(0, BLOCK_SIZE)
    mask = offsets < n_elements

    input_data = tl.load(input_ptr + offsets, mask=mask, other=0.0)

    # 方法1:使用reduce替代atomic操作(推荐)
    local_sum = tl.sum(input_data)

    # 在Block内进行reduce操作,减少global atomic
    if pid == 0:
        # 只在第一个线程执行global atomic
        tl.atomic_add(output_ptr, local_sum)

    # 方法2:分阶段reduce,避免冲突
    # 第一步:Block内reduce
    block_reduced = tl.reduce(input_data, axis=0, op=tl.sum)

    # 第二步:使用单个atomic更新全局内存
    if tl.program_id(axis=0) == 0 and tl.program_id(axis=1) == 0:
        current = tl.load(output_ptr)
        tl.store(output_ptr, current + block_reduced)

def test_atomic_operations():
    """测试atomic操作的替代方案"""
    size = 1024
    input_data = torch.ones(size, device='npu', dtype=torch.float32)
    output_data = torch.zeros(1, device='npu', dtype=torch.float32)

    # 测试标准atomic操作
    try:
        # 标准atomic实现可能在某些环境下有问题
        standard_output = atomic_operation(input_data, output_data.clone())
        print("标准atomic操作成功")
    except Exception as e:
        print(f"标准atomic操作失败: {e}")
        # 回退到reduce方案
        alternative_output = reduce_based_operation(input_data, output_data.clone())
        print("使用reduce方案替代")

    return alternative_output
代码7:Atomic操作调试与替代方案。通过分阶段reduce减少atomic操作冲突。
4.3 Block Size优化调试策略
Block Size的设置显著影响算子性能,需要基于硬件特性进行针对性调优。
def find_optimal_block_size(kernel_func, input_tensor, max_size=2048):
    """自动寻找最优Block Size"""
    test_sizes = [64, 128, 256, 512, 1024, 2048]
    best_time = float('inf')
    best_size = 256
    results = []

    for block_size in test_sizes:
        if block_size > max_size:
            continue

        try:
            # 预热
            for _ in range(5):
                kernel_func(input_tensor, input_tensor, block_size=block_size)

            # 基准测试
            start_time = time.time()
            for _ in range(100):
                result = kernel_func(input_tensor, input_tensor, block_size=block_size)
            elapsed_time = (time.time() - start_time) / 100 * 1000  # 转换为毫秒

            results.append((block_size, elapsed_time))
            print(f"Block Size {block_size}: 耗时 {elapsed_time:.2f}ms")

            if elapsed_time < best_time:
                best_time = elapsed_time
                best_size = block_size

        except Exception as e:
            print(f"Block Size {block_size} 失败: {e}")
            continue

    # 可视化结果
    import matplotlib.pyplot as plt
    sizes, times = zip(*results)

    plt.figure(figsize=(10, 6))
    plt.plot(sizes, times, 'o-')
    plt.xlabel('Block Size')
    plt.ylabel('执行时间 (ms)')
    plt.title('Block Size性能分析')
    plt.grid(True)
    plt.savefig('block_size_analysis.png')

    print(f"最优Block Size: {best_size}, 最佳耗时: {best_time:.2f}ms")
    return best_size, results
代码8:自动Block Size调优工具。通过实验方法找到最优配置。
5 企业级调试实战案例
5.1 大规模矩阵乘法调试案例
以下是一个真实项目中的矩阵乘法调试案例,展示了系统性的调试方法。
@triton.jit
def matmul_kernel(
    a_ptr, b_ptr, c_ptr,
    M, N, K,
    stride_am, stride_ak,
    stride_bk, stride_bn,
    stride_cm, stride_cn,
    BLOCK_SIZE_M: tl.constexpr,
    BLOCK_SIZE_N: tl.constexpr,
    BLOCK_SIZE_K: tl.constexpr,
    GROUP_SIZE_M: tl.constexpr = 8
):
    # 调试点1:验证参数有效性
    tl.static_assert(BLOCK_SIZE_M >= 16, "BLOCK_SIZE_M太小")
    tl.static_assert(BLOCK_SIZE_K >= 16, "BLOCK_SIZE_K太小")

    pid = tl.program_id(axis=0)
    num_pid_m = tl.cdiv(M, BLOCK_SIZE_M)
    num_pid_n = tl.cdiv(N, BLOCK_SIZE_N)
    num_pid_in_group = GROUP_SIZE_M * num_pid_n
    group_id = pid // num_pid_in_group
    first_pid_m = group_id * GROUP_SIZE_M
    group_size_m = min(num_pid_m - first_pid_m, GROUP_SIZE_M)
    pid_m = first_pid_m + (pid % group_size_m)
    pid_n = (pid % num_pid_in_group) // group_size_m

    # 调试点2:输出网格信息
    if pid == 0:
        tl.device_print(f"网格尺寸: M={num_pid_m}, N={num_pid_n}")

    # 矩阵乘计算逻辑
    offs_m = pid_m * BLOCK_SIZE_M + tl.arange(0, BLOCK_SIZE_M)
    offs_n = pid_n * BLOCK_SIZE_N + tl.arange(0, BLOCK_SIZE_N)
    offs_k = tl.arange(0, BLOCK_SIZE_K)

    a_ptrs = a_ptr + (offs_m[:, None] * stride_am + offs_k[None, :] * stride_ak)
    b_ptrs = b_ptr + (offs_k[:, None] * stride_bk + offs_n[None, :] * stride_bn)

    accumulator = tl.zeros((BLOCK_SIZE_M, BLOCK_SIZE_N), dtype=tl.float32)

    for k in range(0, K, BLOCK_SIZE_K):
        # 调试点3:检查边界条件
        a_mask = (offs_m[:, None] < M) & (offs_k[None, :] < K - k)
        b_mask = (offs_k[:, None] < K - k) & (offs_n[None, :] < N)

        a = tl.load(a_ptrs, mask=a_mask, other=0.0)
        b = tl.load(b_ptrs, mask=b_mask, other=0.0)

        # 调试点4:验证数据加载正确性
        if pid == 0 and k == 0:
            tl.device_print("第一个Block数据加载完成")

        accumulator += tl.dot(a, b)

        a_ptrs += BLOCK_SIZE_K * stride_ak
        b_ptrs += BLOCK_SIZE_K * stride_bk

    # 调试点5:检查计算结果有效性
    tl.device_assert(tl.all(accumulator == accumulator), "检测到NaN值")

    c_ptrs = c_ptr + (offs_m[:, None] * stride_cm + offs_n[None, :] * stride_cn)
    c_mask = (offs_m[:, None] < M) & (offs_n[None, :] < N)
    tl.store(c_ptrs, accumulator, mask=c_mask)

def debug_matmul_performance():
    """矩阵乘法性能调试"""
    M, N, K = 2048, 2048, 2048
    a = torch.randn((M, K), device='npu', dtype=torch.float16)
    b = torch.randn((K, N), device='npu', dtype=torch.float16)
    c = torch.empty((M, N), device='npu', dtype=torch.float16)

    # 性能测试配置
    grid_configs = [
        {'BLOCK_SIZE_M': 64, 'BLOCK_SIZE_N': 64, 'BLOCK_SIZE_K': 32},
        {'BLOCK_SIZE_M': 128, 'BLOCK_SIZE_N': 128, 'BLOCK_SIZE_K': 32},
        {'BLOCK_SIZE_M': 256, 'BLOCK_SIZE_N': 64, 'BLOCK_SIZE_K': 32}
    ]

    best_time = float('inf')
    best_config = None

    for config in grid_configs:
        try:
            # 性能测试
            start = time.time()
            matmul_kernel[(M, N, K)](a, b, c, M, N, K,
                                   a.stride(0), a.stride(1),
                                   b.stride(0), b.stride(1),
                                   c.stride(0), c.stride(1),
                                   **config)
            elapsed = time.time() - start

            if elapsed < best_time:
                best_time = elapsed
                best_config = config

            print(f"配置 {config}: 耗时 {elapsed:.4f}s")

        except Exception as e:
            print(f"配置 {config} 失败: {e}")
            continue

    print(f"最优配置: {best_config}, 最佳耗时: {best_time:.4f}s")
    return best_config
代码9:矩阵乘法调试实战。包含参数验证、边界检查、性能测试等完整调试流程。
5.2 高级调试技巧:分层调试策略
在复杂算子开发中,我采用分层调试策略,系统性保证算子正确性和性能。
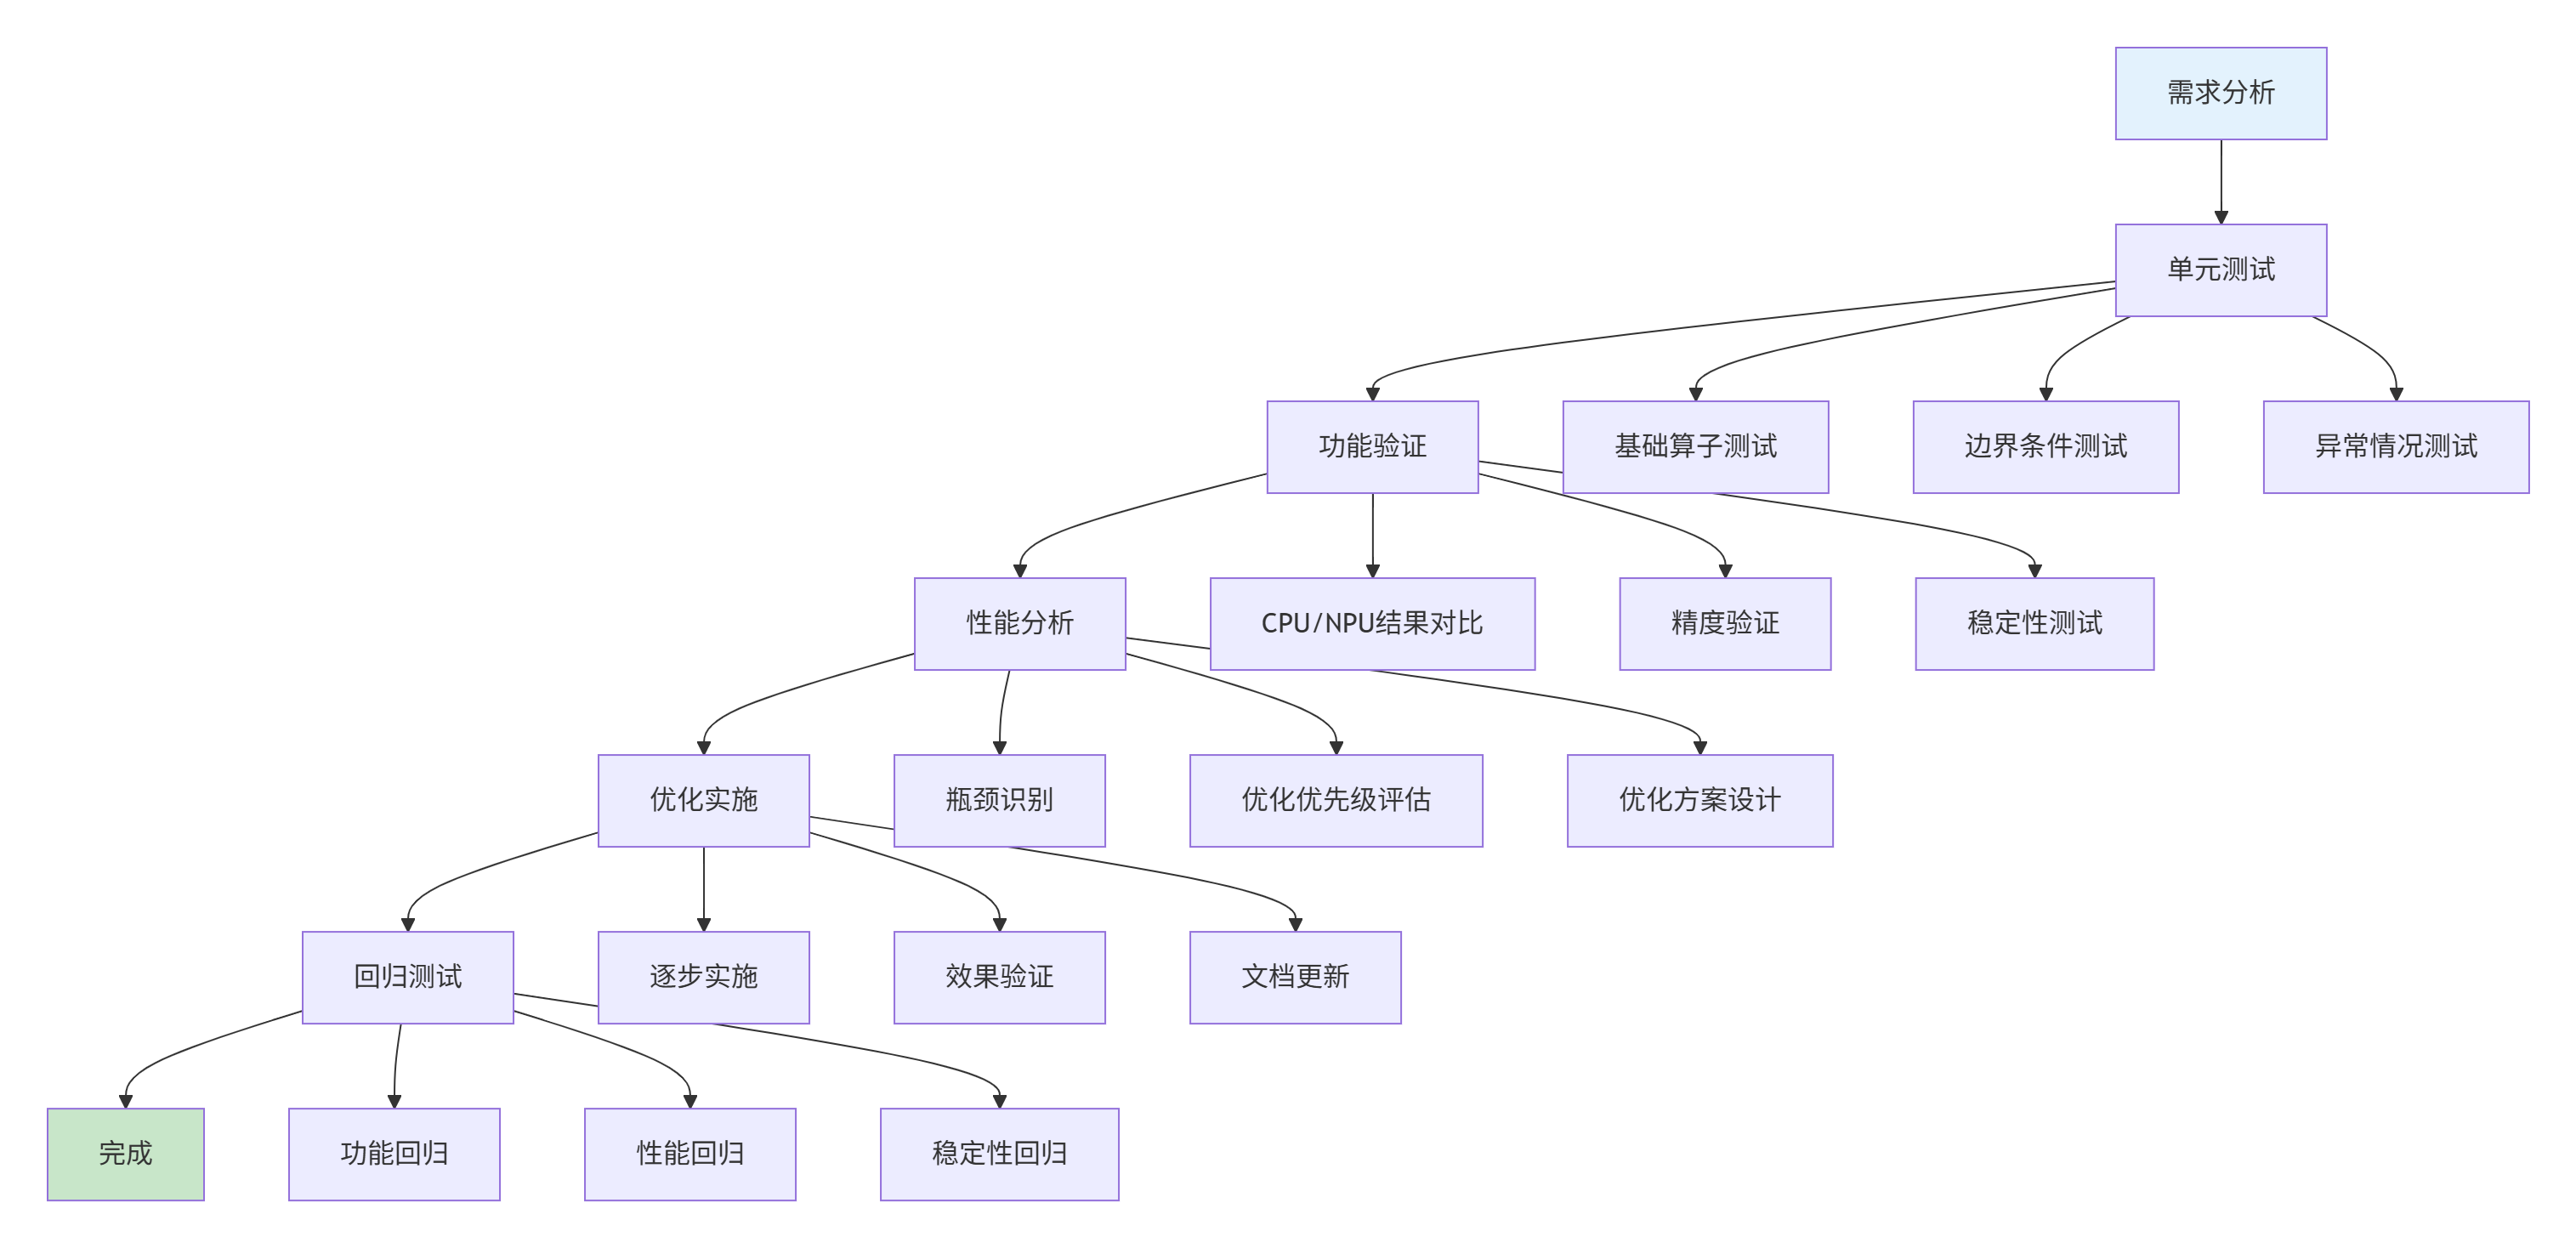
图4:分层调试策略。系统性的调试流程确保算子质量和性能。
6 调试工具的未来发展趋势
基于我在昇腾生态的深度参与,Triton调试技术正朝着智能化、自动化、一体化的方向发展。
6.1 AI辅助调试技术
下一代调试工具将集成AI能力,自动识别问题模式并提供优化建议。DLCompiler等开源项目已经展示了这一趋势。
# 未来AI调试工具的概念实现
class AIDebugAssistant:
    def __init__(self):
        self.pattern_database = self.load_debug_patterns()
        self.performance_model = self.load_performance_model()

    def analyze_kernel(self, kernel_code, performance_data):
        """AI辅助分析核函数问题"""
        issues = []

        # 模式匹配:识别已知问题模式
        for pattern in self.pattern_database:
            if self.match_pattern(kernel_code, pattern):
                issues.append({
                    'type': pattern['type'],
                    'confidence': pattern['confidence'],
                    'suggestion': pattern['suggestion']
                })

        # 性能预测:基于模型预测优化潜力
        performance_gap = self.estimate_performance_gap(
            performance_data, self.performance_model)

        if performance_gap > 0.3:  # 30%性能差距
            issues.append({
                'type': '性能未达预期',
                'confidence': 0.8,
                'suggestion': '可能存在未识别的优化机会'
            })

        return issues

    def generate_optimization_plan(self, issues, constraints):
        """生成个性化优化计划"""
        plan = []
        for issue in sorted(issues, key=lambda x: x['confidence'], reverse=True):
            if issue['confidence'] > 0.7:  # 高置信度问题
                plan.append({
                    'action': f"修复{issue['type']}",
                    'priority': '高',
                    'estimated_impact': '显著'
                })

        return plan
代码10:AI辅助调试工具概念。展示未来调试工具的发展方向。
6.2 云原生调试生态
随着云原生技术的发展,调试工具也将向云端协同方向发展,实现远程调试、协同调试等高级功能。
7 总结与实战建议
7.1 核心调试方法论总结
通过本文的系统性介绍,我们可以总结出Triton昇腾算子调试的核心方法论:
-
预防优于治疗:在编码阶段就考虑可调试性,合理使用调试算子
-
分层调试策略:从CPU模拟到NPU实机,从功能验证到性能优化
-
数据驱动决策:基于性能分析数据而非直觉进行优化
-
自动化调试流程:建立自动化的测试和性能回归体系
7.2 实战调试检查表
基于多年经验,我总结了一份实用的调试检查表,帮助开发者系统性地排查问题:
# Triton算子调试检查表

## 编译期问题
- [ ] 语法检查:使用tl.static_assert验证常量参数
- [ ] 类型检查:确保张量数据类型一致性
- [ ] 维度检查:验证张量形状匹配

## 运行时问题
- [ ] 内存检查:验证指针有效性和对齐
- [ ] 边界检查:使用mask防止越界访问
- [ ] 数据检查:使用tl.device_assert验证数据有效性

## 性能问题
- [ ] 资源利用率:分析AI Core和内存带宽使用情况
- [ ] 瓶颈识别:使用Roofline模型识别瓶颈类型
- [ ] 优化验证:每次优化后验证实际效果

## 稳定性问题
- [ ] 压力测试:长时间运行验证稳定性
- [ ] 边界测试:极端条件验证鲁棒性
- [ ] 回归测试:确保优化不引入新问题
7.3 未来展望
随着AscendNPU IR的开放和毕昇编译器的持续进化,Triton在昇腾平台上的调试体验将进一步提升。未来的调试工具将更加智能化、一体化,为开发者提供更高效的调试体验。
个人建议:对于正在进入昇腾算子开发领域的开发者,我建议尽早掌握系统性的调试方法论,而不仅仅是单个工具的使用。这种系统性思维将在面对复杂问题时展现出巨大价值。
参考链接
官方介绍
昇腾训练营简介:2025年昇腾CANN训练营第二季,基于CANN开源开放全场景,推出0基础入门系列、码力全开特辑、开发者案例等专题课程,助力不同阶段开发者快速提升算子开发技能。获得Ascend C算子中级认证,即可领取精美证书,完成社区任务更有机会赢取华为手机,平板、开发板等大奖。
报名链接: https://www.hiascend.com/developer/activities/cann20252#cann-camp-2502-intro
期待在训练营的硬核世界里,与你相遇!

作为“人工智能6S店”的官方数字引擎,为AI开发者与企业提供一个覆盖软硬件全栈、一站式门户。
更多推荐

 21
21 0
0- 0


 已为社区贡献5条内容

所有评论(0)